- Phân tích
- Tin tức và các công cụ
- Tin tức thị trường
- AUD/USD Price Analysis: Bulls moving in at a discount to target 0.68s
AUD/USD Price Analysis: Bulls moving in at a discount to target 0.68s
- AUD/USD bulls are moving in from a peak bottom formation.
- Focus is on a move into the 0.68s for the days ahead.
- Eyes on DXY headed towards 102.00 while on front side of bearish cycle's trendline.
As per the prior day's analysis, AUD/USD Price Analysis: Bulls are moving in with eyes on a 61.8% Fibonacci retracement towards 0.6800, while the overall thesis is for a move to 0.6500, there is a meanwhile prospect for 0.6800 still.
In the latest price action, we have seen a sweep of liquidity to 0.6630 which could now result in a move to the upside with 0.6700 as a focus and then 0.6736 to make way for 0.6800 as the following analysis of the current schematic illustrates.
AUD/USD prior analysis
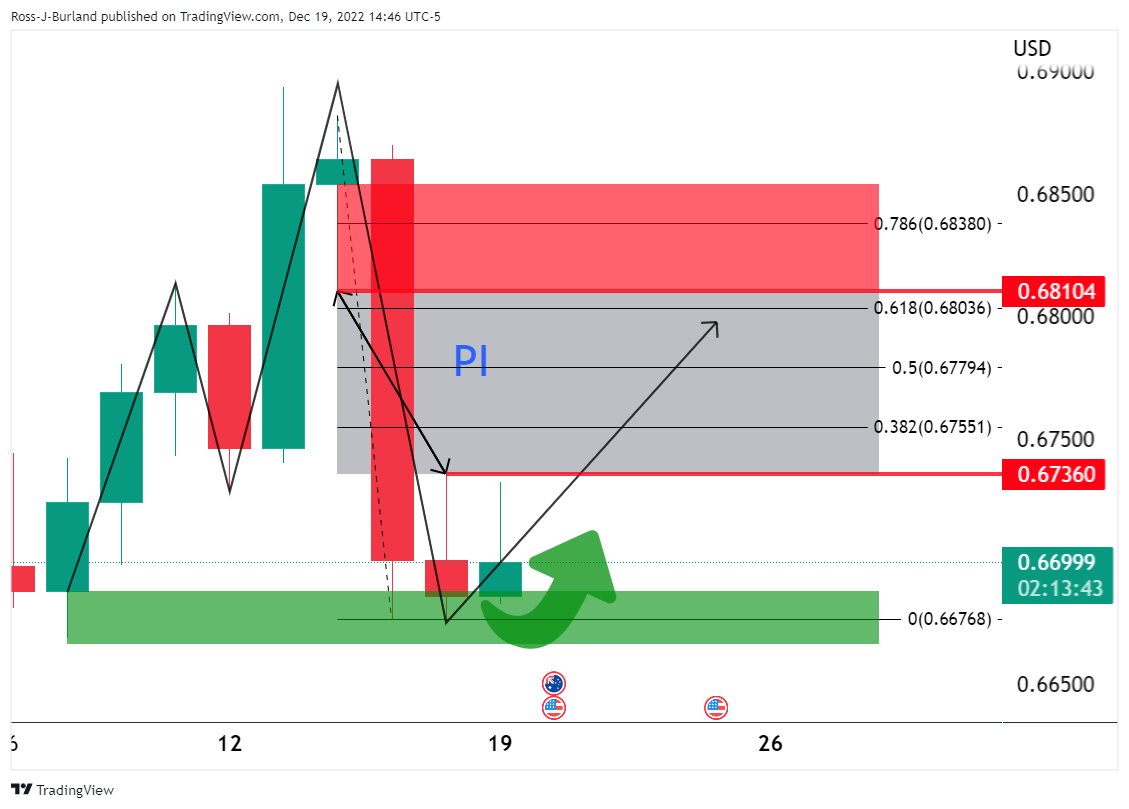
On the daily time frame it was shown that there is a price imbalance (PI) between 0.6736 and 0.6810 with the 61.8% ratio eyed as a confluence:
On the lower time frames, it was stated that the bulls will want to see a break of the trendline and prior lower high to confirm a bullish bias:
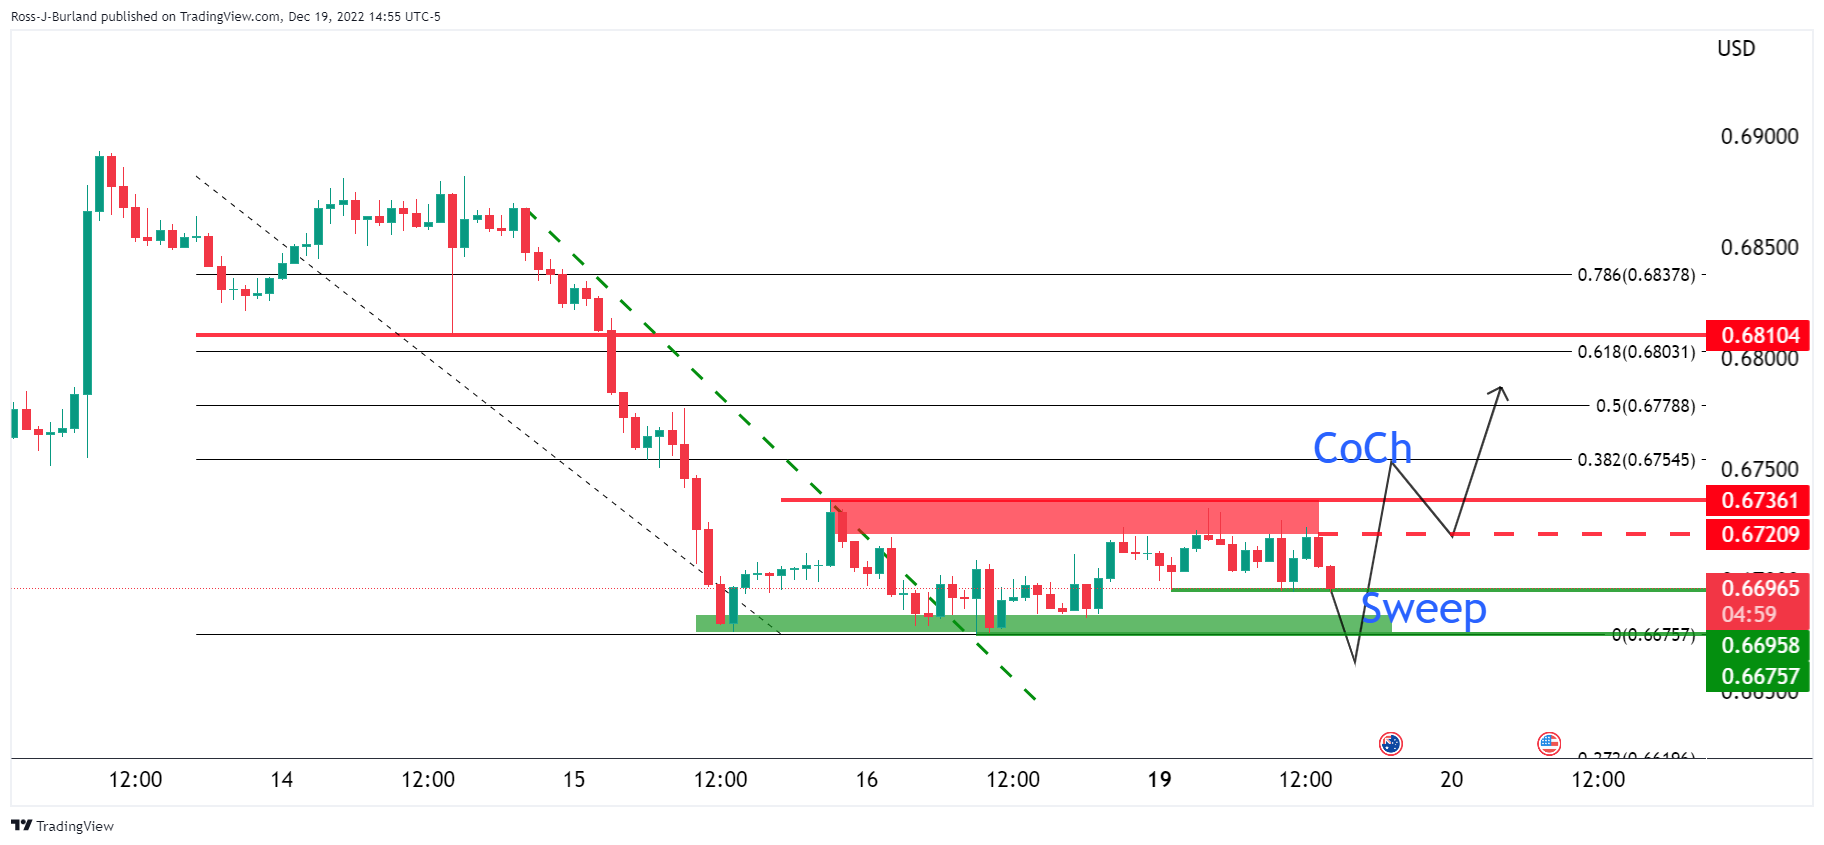
It was shown that there was a break in the trendline on the hourly chart but the market was coiling sideways.
there were equal lows at 0.6695 that were being pressured with liquidity in market orders expected below and under 0.6675 lows.
It was stated that a ''sweep' of the liquidity could result in a surge of demand from the bulls and ultimately provide enough fuel to take out the 0.6720 and then the 0.6736 resistance and create a change of character (CoCh) in the structure to bullish.
However, for the immediate future, 0.6685 and 0.6700 are going to be important levels:
AUD/USD update
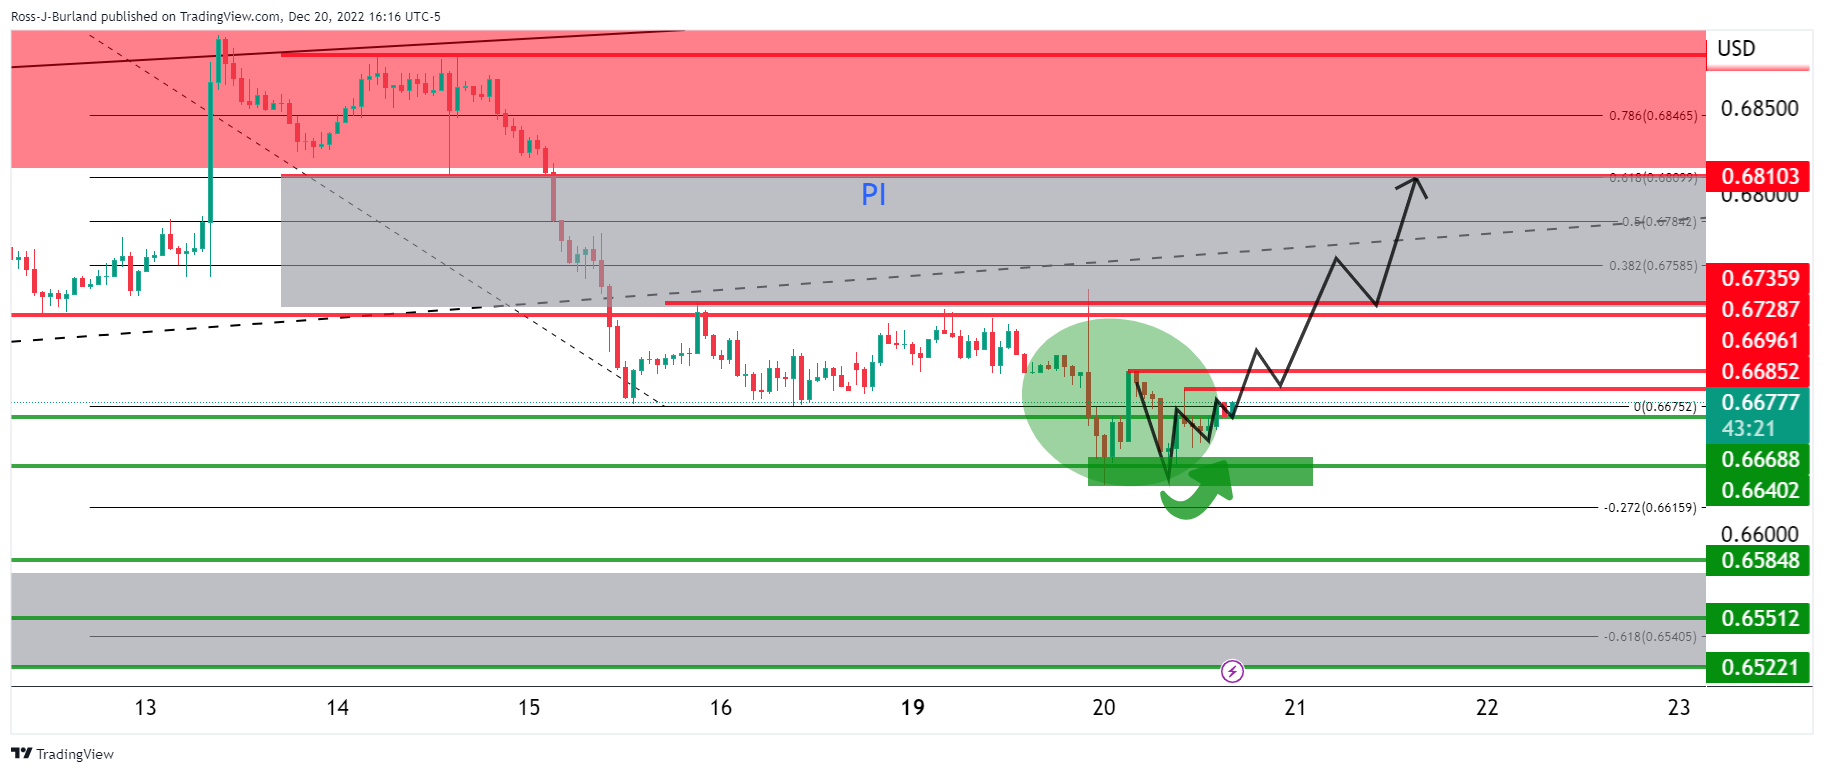
The W-formation is being formed and should the neckline hold around 0.6670, then there will be prospects of a move to test 0.6685 resistance. A break here will result in a change of character in the market and put the bulls back into control as per the daily chart:

This would tie up with the outlook for the US dollar as per the DXY daily chart:
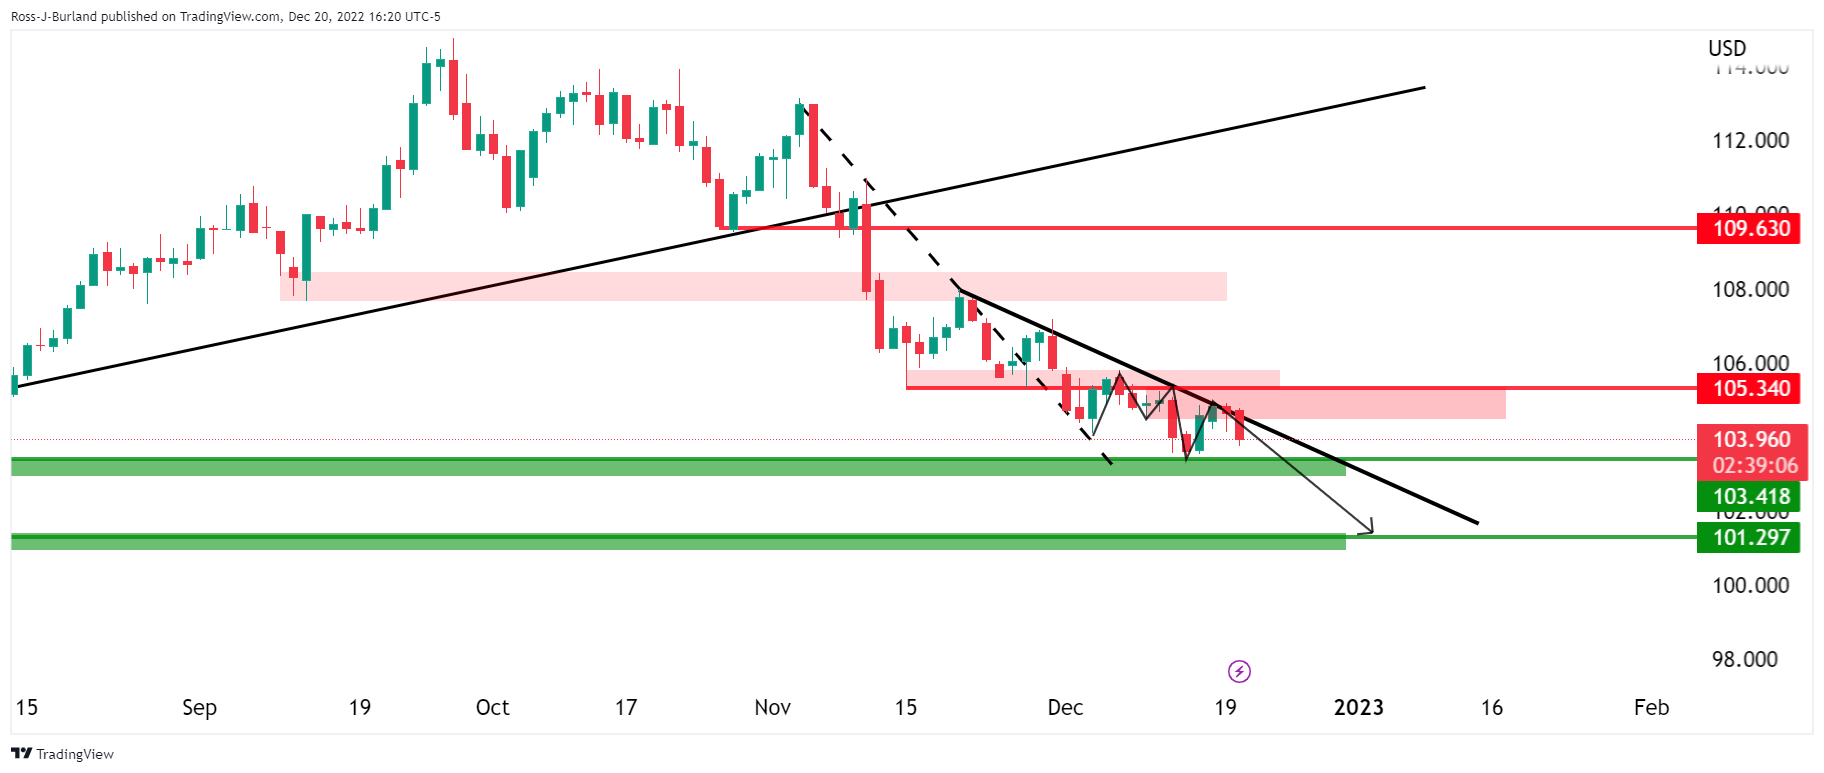
In prior analysis:
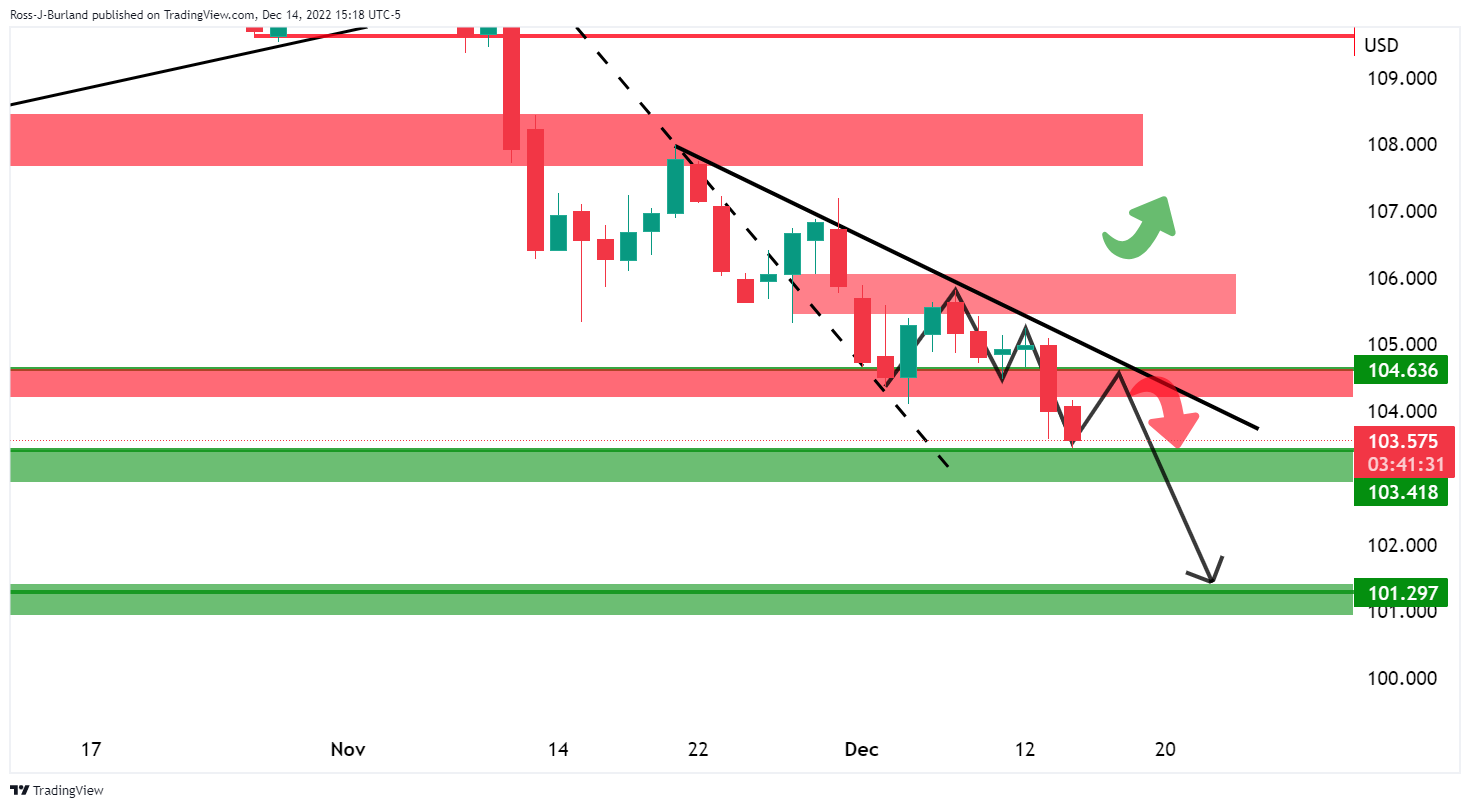
It was stated that the M-formation is a reversion pattern that had shown up on the daily chart above.
While on the front side of the trendline, a move into the neckline would be considered the next phase of the bearish cycle prior to a downside continuation to test 102.00 and below. We are now in the throws of such a move as illustrated above.


© 2000-2026. Bản quyền Teletrade.
Trang web này được quản lý bởi Teletrade D.J. LLC 2351 LLC 2022 (Euro House, Richmond Hill Road, Kingstown, VC0100, St. Vincent and the Grenadines).
Thông tin trên trang web không phải là cơ sở để đưa ra quyết định đầu tư và chỉ được cung cấp cho mục đích làm quen.
Giao dịch trên thị trường tài chính (đặc biệt là giao dịch sử dụng các công cụ biên) mở ra những cơ hội lớn và tạo điều kiện cho các nhà đầu tư sẵn sàng mạo hiểm để thu lợi nhuận, tuy nhiên nó mang trong mình nguy cơ rủi ro khá cao. Chính vì vậy trước khi tiến hành giao dịch cần phải xem xét mọi mặt vấn đề chấp nhận tiến hành giao dịch cụ thể xét theo quan điểm của nguồn lực tài chính sẵn có và mức độ am hiểu thị trường tài chính.
Sử dụng thông tin: sử dụng toàn bộ hay riêng biệt các dữ liệu trên trang web của công ty TeleTrade như một nguồn cung cấp thông tin nhất định. Việc sử dụng tư liệu từ trang web cần kèm theo liên kết đến trang teletrade.vn. Việc tự động thu thập số liệu cũng như thông tin từ trang web TeleTrade đều không được phép.
Xin vui lòng liên hệ với pr@teletrade.global nếu có câu hỏi.
ngân hàng