- Phân tích
- Tin tức và các công cụ
- Tin tức thị trường
- Gold Price Forecast: XAU/USD bulls hold the fort amid bumpy road near $1,815 – Confluence Detector
Gold Price Forecast: XAU/USD bulls hold the fort amid bumpy road near $1,815 – Confluence Detector
- Gold price grinds higher while keeping the upside break of $1,805 key support.
- Mixed catalyst surrounding China, Russia fail to depress XAU/USD bulls amid doubts on hawkish Fed bets.
- Expectations of easy rates, economic recovery underpin bullish bias for Gold even as multiple hurdles probe upside momentum.
Gold price (XAU/USD) prints the second consecutive gain on the daily, weekly and monthly formats as bulls brace for an upbeat 2023 amid economic optimism and hopes of lower rates. Also likely to have favored the XAU/USD buyers could be the recently softer US data, as well as a pullback in the US Treasury bond yields. It’s worth mentioning that Asian economies like India and China are likely to be the growth engine in the next and could help the Gold buyers to keep the reins due to their higher consumption of the bullion. Alternatively, Covid woes in China and the geopolitical fears surrounding Ukraine could join the recent weakness in global equities, on a monthly and quarterly basis, to probe the Gold buyers. Additionally, a light calendar and the holiday mood also challenge the metal’s recent moves.
Also read: Gold Price Forecast: Will XAU/USD close the final day of 2022 above $1,825?
Gold Price: Key levels to watch
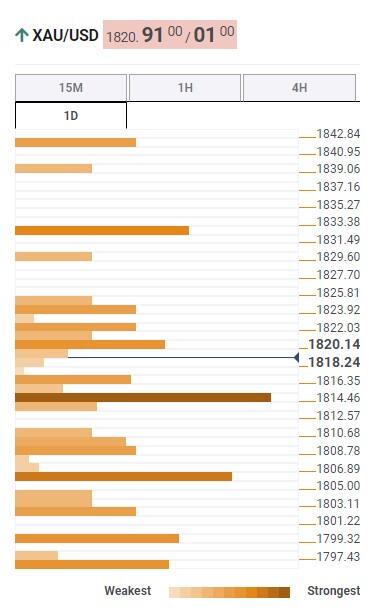
The Technical Confluence Detector shows that the Gold price stays firmer past the Fibonacci 38.2% one-day resistance, now support at $1,813. Also increasing the strength of the stated resistance-turned-support is the Fibonacci 23.6% one-week and middle band of the hourly Bollinger.
That said, the Gold price is firmly on the way to the previous daily high and Pivot Point one-week R1 surrounding $1,820. Following that, multiple hurdles near $1,825 could test the upside momentum before directing XAU/USD buyers to the $1,833 hurdle encompassing Point one-month R1.
On the contrary, a downside break of the $1,813 key support could drag the prices to the $1,805 support including the 5-DMA, Point one-day S1 and 200-HMA.
It’s worth noting that the quote’s weakness past $1,805 will seek validation from the $1,800 threshold before welcoming the Gold bears.
Here is how it looks on the tool
About Technical Confluences Detector
The TCD (Technical Confluences Detector) is a tool to locate and point out those price levels where there is a congestion of indicators, moving averages, Fibonacci levels, Pivot Points, etc. If you are a short-term trader, you will find entry points for counter-trend strategies and hunt a few points at a time. If you are a medium-to-long-term trader, this tool will allow you to know in advance the price levels where a medium-to-long-term trend may stop and rest, where to unwind positions, or where to increase your position size.


© 2000-2026. Bản quyền Teletrade.
Trang web này được quản lý bởi Teletrade D.J. LLC 2351 LLC 2022 (Euro House, Richmond Hill Road, Kingstown, VC0100, St. Vincent and the Grenadines).
Thông tin trên trang web không phải là cơ sở để đưa ra quyết định đầu tư và chỉ được cung cấp cho mục đích làm quen.
Giao dịch trên thị trường tài chính (đặc biệt là giao dịch sử dụng các công cụ biên) mở ra những cơ hội lớn và tạo điều kiện cho các nhà đầu tư sẵn sàng mạo hiểm để thu lợi nhuận, tuy nhiên nó mang trong mình nguy cơ rủi ro khá cao. Chính vì vậy trước khi tiến hành giao dịch cần phải xem xét mọi mặt vấn đề chấp nhận tiến hành giao dịch cụ thể xét theo quan điểm của nguồn lực tài chính sẵn có và mức độ am hiểu thị trường tài chính.
Sử dụng thông tin: sử dụng toàn bộ hay riêng biệt các dữ liệu trên trang web của công ty TeleTrade như một nguồn cung cấp thông tin nhất định. Việc sử dụng tư liệu từ trang web cần kèm theo liên kết đến trang teletrade.vn. Việc tự động thu thập số liệu cũng như thông tin từ trang web TeleTrade đều không được phép.
Xin vui lòng liên hệ với pr@teletrade.global nếu có câu hỏi.
ngân hàng