- Phân tích
- Tin tức và các công cụ
- Tin tức thị trường
- Gold Price Forecast: XAU/USD bulls need validation from $1,835 – Confluence Detector
Gold Price Forecast: XAU/USD bulls need validation from $1,835 – Confluence Detector
- Gold price struggle for clear directions amid holiday mood.
- US Dollar Index rebounds amid risk-negative headlines surrounding China, pre-data caution.
- Fed Minutes, US NFP will be crucial as XAU/USD struggles around key resistance.
Gold price (XAU/USD) remains sidelined as holidays in major markets restrict the precious metal’s moves during early Monday. Also acting as an upside filter is the US Dollar’s rebound amid escalating fears from China, as well as headlines suggesting the US growth optimism, backed by comments from the International Monetary Fund’s (IMF) Managing Director Kristalina Georgieva. Even so, the recently softer US data, mainly surrounding inflation and activities, join an absence of the hawkish Fedspeak to keep Gold buyers hopeful.
That said, Gold traders may witness inaction during the rest of the day but the current week holds multiple key catalysts and hence become warrants caution. Among them, this week’s activity data from the US, Minutes of the latest Federal Open Market Committee (FOMC) meeting and December month employment numbers are crucial for clear directions.
Also read: Gold Price Annual Forecast: Will 2023 be the year Gold shines?
Gold Price: Key levels to watch
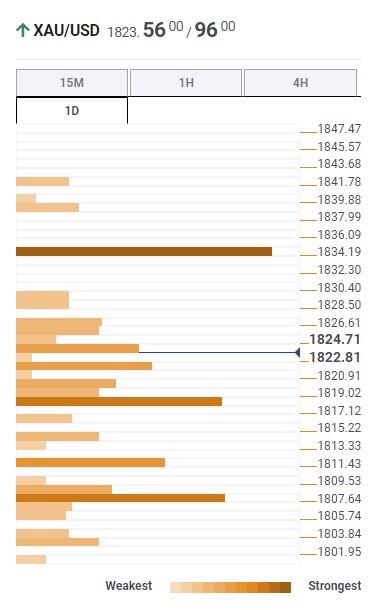
The Technical Confluence Detector shows that the Gold price grinds higher towards the $1,835 key hurdle comprising the previous weekly and monthly high, as well as the Pivot Point one-day R2.
Following that, a run-up towards June 2022 peak surrounding $1,880 can’t be ruled out.
Alternatively, pullback moves remain elusive beyond the $1,819 level that includes Fibonacci 61.8% on one-day and SMA10 on 4H.
In a case where the Gold price drops below $1,819, a convergence of the 200-HMA and Pivot Point one-day S2, around $1,808, will be crucial to watch.
Should the Gold bears keep the reins past $1,808, the odds of witnessing a slump toward the $1,800 threshold can’t be ruled out.
Here is how it looks on the tool
About Technical Confluences Detector
The TCD (Technical Confluences Detector) is a tool to locate and point out those price levels where there is a congestion of indicators, moving averages, Fibonacci levels, Pivot Points, etc. If you are a short-term trader, you will find entry points for counter-trend strategies and hunt a few points at a time. If you are a medium-to-long-term trader, this tool will allow you to know in advance the price levels where a medium-to-long-term trend may stop and rest, where to unwind positions, or where to increase your position


© 2000-2026. Bản quyền Teletrade.
Trang web này được quản lý bởi Teletrade D.J. LLC 2351 LLC 2022 (Euro House, Richmond Hill Road, Kingstown, VC0100, St. Vincent and the Grenadines).
Thông tin trên trang web không phải là cơ sở để đưa ra quyết định đầu tư và chỉ được cung cấp cho mục đích làm quen.
Giao dịch trên thị trường tài chính (đặc biệt là giao dịch sử dụng các công cụ biên) mở ra những cơ hội lớn và tạo điều kiện cho các nhà đầu tư sẵn sàng mạo hiểm để thu lợi nhuận, tuy nhiên nó mang trong mình nguy cơ rủi ro khá cao. Chính vì vậy trước khi tiến hành giao dịch cần phải xem xét mọi mặt vấn đề chấp nhận tiến hành giao dịch cụ thể xét theo quan điểm của nguồn lực tài chính sẵn có và mức độ am hiểu thị trường tài chính.
Sử dụng thông tin: sử dụng toàn bộ hay riêng biệt các dữ liệu trên trang web của công ty TeleTrade như một nguồn cung cấp thông tin nhất định. Việc sử dụng tư liệu từ trang web cần kèm theo liên kết đến trang teletrade.vn. Việc tự động thu thập số liệu cũng như thông tin từ trang web TeleTrade đều không được phép.
Xin vui lòng liên hệ với pr@teletrade.global nếu có câu hỏi.
ngân hàng