- Phân tích
- Tin tức và các công cụ
- Tin tức thị trường
- Gold Price Forecast: XAU/USD bulls keep sight on $1,865 ahead of US jobs data – Confluence Detector
Gold Price Forecast: XAU/USD bulls keep sight on $1,865 ahead of US jobs data – Confluence Detector
- Gold price struggling to find demand amid a pause in the US Dollar downside.
- Market mood turns cautious while US Treasury yields hover near weekly troughs.
- With the Fed Minutes out of the way, all eyes remain on US employment data.
Gold price is looking to build on the previous rally above $1,850, as bulls gather pace for the next push higher. The bright metal is struggling to find fresh demand, as investors turn cautious and flock to safety in the US Dollar. Meanwhile, the US Treasury bond yields are holding near weekly lows, limiting any downside for Gold buyers. The US Dollar incurred steep losses on Wednesday, as the mixed US ISM Manufacturing PMI data and US Federal Reserve (Fed) Minutes failed to impress. Even though the Fed Minutes showed that the officials are committed to fighting inflation and expect higher interest rates to remain in place, markets continue pricing a dovish Fed pivot by the end of 2023, as recession risks amplify. Attention now turns toward the US employment data, as it will provide further insight into the Fed’s policy path this year.
Also read: XAU/USD outlook: Bulls accelerate on expectations for more dovish Fed
Gold Price: Key levels to watch
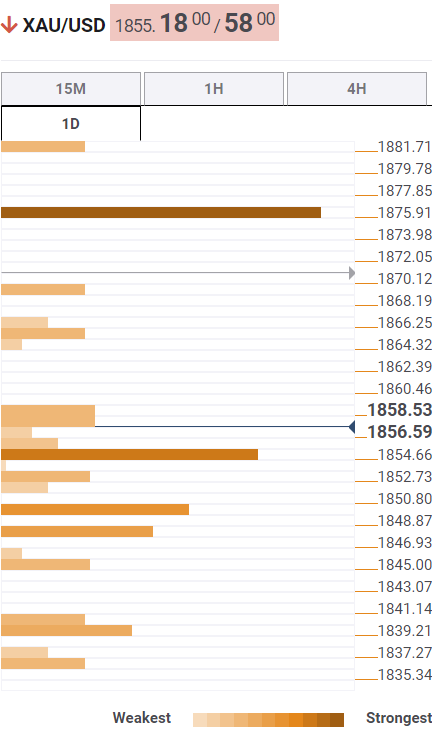
The Technical Confluence Detector shows that the gold price is challenging the bullish commitments at $1,854, which is the convergence of Fibonacci 38.2% one-day and pivot point one-week R2.
A firm break below the latter will call for a test of the pivot point one-month R1 at $1,850. The next immediate support is seen at the Fibonacci 61.8% one-day at $1,847.
The last line of defense for Gold buyers is placed at the Bollinger Band one-day Upper at $1,845.
Alternatively, if buyers regain momentum, then the Fibonacci 23.6% one-day at $1,857 will offer stiff resistance.
The next upside target is envisioned at the $1,860 round number, above which the previous day’s high at $1,865 will be put to test.
Here is how it looks on the tool
About Technical Confluences Detector
The TCD (Technical Confluences Detector) is a tool to locate and point out those price levels where there is a congestion of indicators, moving averages, Fibonacci levels, Pivot Points, etc. If you are a short-term trader, you will find entry points for counter-trend strategies and hunt a few points at a time. If you are a medium-to-long-term trader, this tool will allow you to know in advance the price levels where a medium-to-long-term trend may stop and rest, where to unwind positions, or where to increase your position size.


© 2000-2026. Bản quyền Teletrade.
Trang web này được quản lý bởi Teletrade D.J. LLC 2351 LLC 2022 (Euro House, Richmond Hill Road, Kingstown, VC0100, St. Vincent and the Grenadines).
Thông tin trên trang web không phải là cơ sở để đưa ra quyết định đầu tư và chỉ được cung cấp cho mục đích làm quen.
Giao dịch trên thị trường tài chính (đặc biệt là giao dịch sử dụng các công cụ biên) mở ra những cơ hội lớn và tạo điều kiện cho các nhà đầu tư sẵn sàng mạo hiểm để thu lợi nhuận, tuy nhiên nó mang trong mình nguy cơ rủi ro khá cao. Chính vì vậy trước khi tiến hành giao dịch cần phải xem xét mọi mặt vấn đề chấp nhận tiến hành giao dịch cụ thể xét theo quan điểm của nguồn lực tài chính sẵn có và mức độ am hiểu thị trường tài chính.
Sử dụng thông tin: sử dụng toàn bộ hay riêng biệt các dữ liệu trên trang web của công ty TeleTrade như một nguồn cung cấp thông tin nhất định. Việc sử dụng tư liệu từ trang web cần kèm theo liên kết đến trang teletrade.vn. Việc tự động thu thập số liệu cũng như thông tin từ trang web TeleTrade đều không được phép.
Xin vui lòng liên hệ với pr@teletrade.global nếu có câu hỏi.
ngân hàng