- Phân tích
- Tin tức và các công cụ
- Tin tức thị trường
- GBP/USD Price Analysis: Breakdown of H&S looks likely
GBP/USD Price Analysis: Breakdown of H&S looks likely
- A mild recovery in S&P500 futures is indicating that the risk-on mood is attempting to regain traction.
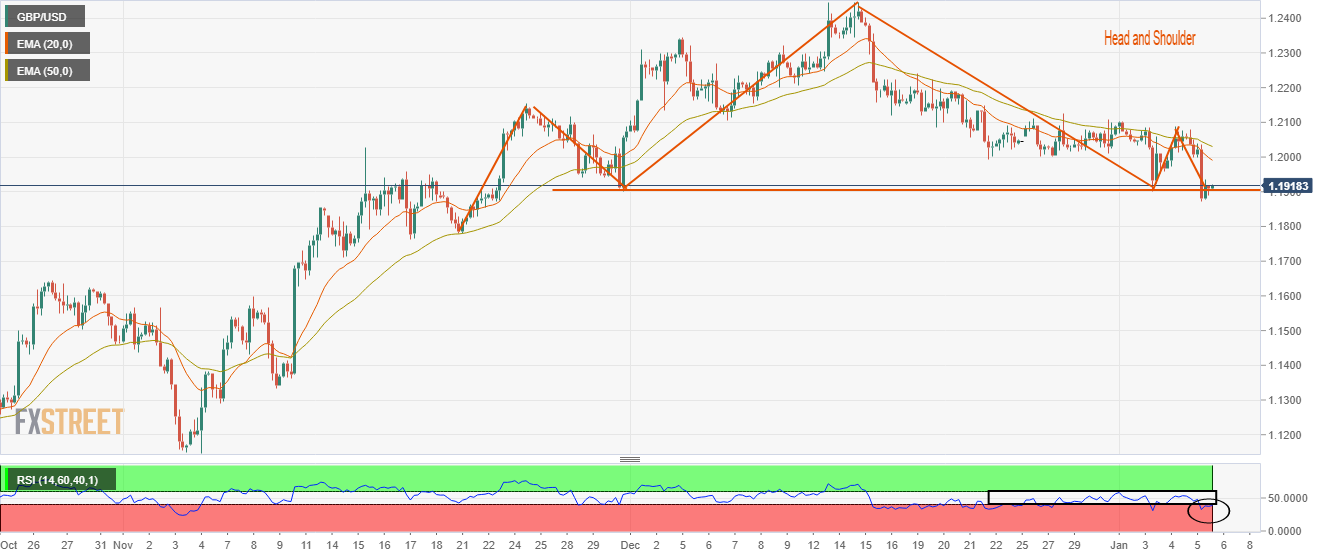
- A breakdown of an H&S chart pattern will result in the sheer downside ahead.
- The RSI (14) has slipped into the bearish range of 20.00-40.00, which indicates more weakness ahead.
The GBP/USD pair has sensed a temporary demand below the critical support of 1.1900 in the Asian session, however, the broader set of the risk profile is extremely negative. The Cable asset is likely to remain on the tenterhooks as stronger United States job market data has accelerated the odds of further policy tightening consideration by the Federal Reserve (Fed).
S&P500 futures have displayed a higher tick in early Asia after a massive sell-off on Thursday but still portraying caution before turning to risk-sensitive assets. The US Dollar Index (DXY) is expected to display a sideways action ahead of the release of the US Nonfarm Payrolls (NFP) data.
On a four-hour scale, the Cable is hovering near the neckline of the Head and Shoulder (H&S) chart pattern, which is plotted from December 29 low around 1.1900. The aforementioned chart pattern indicates a stretched inventory distribution, which results in volatility expansion after a breakdown.
Declining 20-and 50-period Exponential Moving Averages (EMAs) at 1.1990 and 1.2010 respectively add to the downside filters.
Also, the Relative Strength Index (RSI) (14) has slipped into the bearish range of 20.00-40.00, which indicates more weakness ahead.
Going forward, a slippage below Thursday's low at 1.1873 will drag the major toward November 21 low around 1.1778. A slippage below the latter will expose Cable for more downside towards the round-level support at 1.1700.
On the flip side, the Pound Sterling needs to push the Cable decisively above December 27 high around 1.2100 for an upside move, which will drive the major towards December 21 high at 1.2147 followed by December 21 high around 1.2200.
GBP/USD four-hour chart


© 2000-2026. Bản quyền Teletrade.
Trang web này được quản lý bởi Teletrade D.J. LLC 2351 LLC 2022 (Euro House, Richmond Hill Road, Kingstown, VC0100, St. Vincent and the Grenadines).
Thông tin trên trang web không phải là cơ sở để đưa ra quyết định đầu tư và chỉ được cung cấp cho mục đích làm quen.
Giao dịch trên thị trường tài chính (đặc biệt là giao dịch sử dụng các công cụ biên) mở ra những cơ hội lớn và tạo điều kiện cho các nhà đầu tư sẵn sàng mạo hiểm để thu lợi nhuận, tuy nhiên nó mang trong mình nguy cơ rủi ro khá cao. Chính vì vậy trước khi tiến hành giao dịch cần phải xem xét mọi mặt vấn đề chấp nhận tiến hành giao dịch cụ thể xét theo quan điểm của nguồn lực tài chính sẵn có và mức độ am hiểu thị trường tài chính.
Sử dụng thông tin: sử dụng toàn bộ hay riêng biệt các dữ liệu trên trang web của công ty TeleTrade như một nguồn cung cấp thông tin nhất định. Việc sử dụng tư liệu từ trang web cần kèm theo liên kết đến trang teletrade.vn. Việc tự động thu thập số liệu cũng như thông tin từ trang web TeleTrade đều không được phép.
Xin vui lòng liên hệ với pr@teletrade.global nếu có câu hỏi.
ngân hàng