- Phân tích
- Tin tức và các công cụ
- Tin tức thị trường
- Gold Price Forecast: XAU/USD eyes $1,918 and $1,922 on the road to recovery – Confluence Detector
Gold Price Forecast: XAU/USD eyes $1,918 and $1,922 on the road to recovery – Confluence Detector
- Gold price stages a decent comeback as US Dollar falls with Treasury bond yields.
- USD/JPY reversal post-BoJ also weighs down on the US Dollar ahead of US data.
- Gold price needs to take out the key $1,918 barrier to resume the uptrend.
Gold price has stalled its ongoing corrective downside, staging a decent comeback so far this Wednesday. The US Dollar has reversed its early gains amid falling US Treasury bond yields, which has helped Gold price recover lost ground. Meanwhile, Gold price continues to benefit from increased bets of smaller US Federal Reserve (Fed) rate hikes, although the US Retail Sales and Producer Price Index (PPI) will help shed more light on the same. Earlier in the day. the Bank of Japan (BoJ) stood pat on its yield control policy, which drove USD/JPY through the roof, propelling the US Dollar in tandem. Although the moves are seen reversing, as investors gear up for the high-impact US economic data.
Also read: Gold Price Forecast: XAU/USD eyes further correction toward $1,870 amid bearish technicals
Gold Price: Key levels to watch
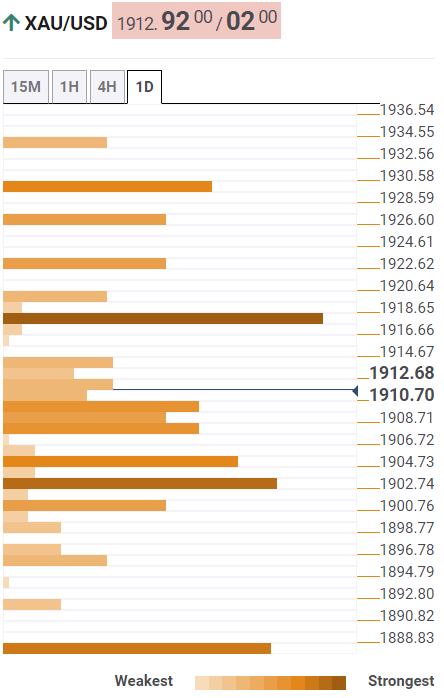
The Technical Confluence Detector shows that the gold price is facing immediate resistance at $1,914, which is the Fibonacci 61.8% one-day.
A break above which will put the powerful hurdle at $1,918 under threat. That level is the convergence of the pivot point one-month R3 and pivot point one-day R1.
Acceptance above the latter is critical to extending the renewed upside toward the previous week’s high at $1,922. Further up, the nine-month top at $1,929 will challenge bearish commitments.
On the flip side, a dense cluster of healthy support levels awaits around $1,909, which is the meeting point of the Fibonacci 23.6% one-week, Fibonacci 38.2% one-day and SMA5 four-hour.
Should bears flex their muscles, then the previous day’s low at $1,903 could be put to test. The last line of defense for Gold buyers is seen at the Fibonacci 38.2% one-week at $1,899.
Here is how it looks on the tool
About Technical Confluences Detector
The TCD (Technical Confluences Detector) is a tool to locate and point out those price levels where there is a congestion of indicators, moving averages, Fibonacci levels, Pivot Points, etc. If you are a short-term trader, you will find entry points for counter-trend strategies and hunt a few points at a time. If you are a medium-to-long-term trader, this tool will allow you to know in advance the price levels where a medium-to-long-term trend may stop and rest, where to unwind positions, or where to increase your position size.


© 2000-2026. Bản quyền Teletrade.
Trang web này được quản lý bởi Teletrade D.J. LLC 2351 LLC 2022 (Euro House, Richmond Hill Road, Kingstown, VC0100, St. Vincent and the Grenadines).
Thông tin trên trang web không phải là cơ sở để đưa ra quyết định đầu tư và chỉ được cung cấp cho mục đích làm quen.
Giao dịch trên thị trường tài chính (đặc biệt là giao dịch sử dụng các công cụ biên) mở ra những cơ hội lớn và tạo điều kiện cho các nhà đầu tư sẵn sàng mạo hiểm để thu lợi nhuận, tuy nhiên nó mang trong mình nguy cơ rủi ro khá cao. Chính vì vậy trước khi tiến hành giao dịch cần phải xem xét mọi mặt vấn đề chấp nhận tiến hành giao dịch cụ thể xét theo quan điểm của nguồn lực tài chính sẵn có và mức độ am hiểu thị trường tài chính.
Sử dụng thông tin: sử dụng toàn bộ hay riêng biệt các dữ liệu trên trang web của công ty TeleTrade như một nguồn cung cấp thông tin nhất định. Việc sử dụng tư liệu từ trang web cần kèm theo liên kết đến trang teletrade.vn. Việc tự động thu thập số liệu cũng như thông tin từ trang web TeleTrade đều không được phép.
Xin vui lòng liên hệ với pr@teletrade.global nếu có câu hỏi.
ngân hàng