- Phân tích
- Tin tức và các công cụ
- Tin tức thị trường
- Gold Price Forecast: XAU/USD appears pressured towards $1,890 – Confluence Detector
Gold Price Forecast: XAU/USD appears pressured towards $1,890 – Confluence Detector
- Gold price prints four-day downtrend as US Dollar licks its wounds near multi-day low.
- Failure to stay beyond $1,910 hurdle keeps XAU/USD bears hopeful amid mixed sentiment.
- Fed talks, China concerns should be watched carefully for clear directions.
Gold price (XAU/USD) remains depressed around the weekly low near the $1,900 threshold, declining for the fourth consecutive day, as the US Dollar bounces off a multi-day low amid contrasting signals from the US data and Federal Reserve (Fed) officials. Also challenging the Gold price are the mixed concerns surrounding China, one of the biggest XAU/USD consumers. Furthermore, a pause in the US Treasury bond yields amid fresh recession fears also weighs on the Gold price amid a light calendar. That said, central bankers could entertain the Gold traders ahead of the likely inactive week due to the Chinese Lunar New Year holidays.
Also read: Gold Price Forecast: Recession fears weighing on XAU/USD
Gold Price: Key levels to watch
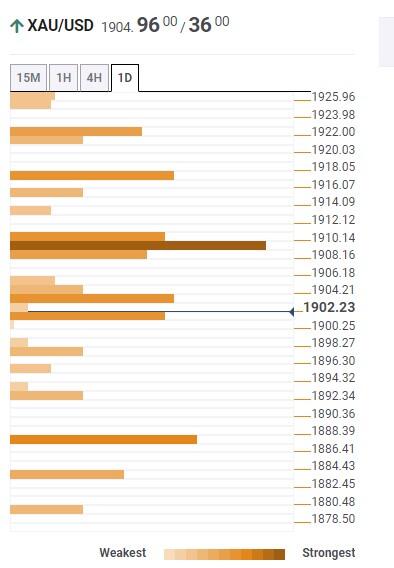
The Technical Confluence Detector shows that the gold price grinds lower past the $1,910 key resistance comprising the 50-HMA, 5-DMA and Middle band of the Bollinger on the hourly play.
Also keeping the Gold sellers hopeful is the metal’s recent dip below the previous low on the Four-hour (4H).
It’s worth noting, however, that the $1,900 threshold that encompasses Fibonacci 38.2% on one week and the Lower Bollinger on 4H appears a tough nut t to crack for short-term XAU/USD bears.
Following that, a slump towards the $1,890 support confluence, including the Fibonacci 61.8% on weekly and 10-DMA, can’t be ruled out.
Meanwhile, recovery moves need validation from the $1,910 hurdle to recall the Gold buyers. Also challenging XAU/USD bulls is the Pivot point one-month R3, near $1,920.
It should be noted that the previous weekly high of around $1,925 and the $1,930 could act as the last defense of the Gold bears.
Here is how it looks on the tool
About Technical Confluences Detector
The TCD (Technical Confluences Detector) is a tool to locate and point out those price levels where there is a congestion of indicators, moving averages, Fibonacci levels, Pivot Points, etc. If you are a short-term trader, you will find entry points for counter-trend strategies and hunt a few points at a time. If you are a medium-to-long-term trader, this tool will allow you to know in advance the price levels where a medium-to-long-term trend may stop and rest, where to unwind positions, or where to increase your position size.


© 2000-2026. Bản quyền Teletrade.
Trang web này được quản lý bởi Teletrade D.J. LLC 2351 LLC 2022 (Euro House, Richmond Hill Road, Kingstown, VC0100, St. Vincent and the Grenadines).
Thông tin trên trang web không phải là cơ sở để đưa ra quyết định đầu tư và chỉ được cung cấp cho mục đích làm quen.
Giao dịch trên thị trường tài chính (đặc biệt là giao dịch sử dụng các công cụ biên) mở ra những cơ hội lớn và tạo điều kiện cho các nhà đầu tư sẵn sàng mạo hiểm để thu lợi nhuận, tuy nhiên nó mang trong mình nguy cơ rủi ro khá cao. Chính vì vậy trước khi tiến hành giao dịch cần phải xem xét mọi mặt vấn đề chấp nhận tiến hành giao dịch cụ thể xét theo quan điểm của nguồn lực tài chính sẵn có và mức độ am hiểu thị trường tài chính.
Sử dụng thông tin: sử dụng toàn bộ hay riêng biệt các dữ liệu trên trang web của công ty TeleTrade như một nguồn cung cấp thông tin nhất định. Việc sử dụng tư liệu từ trang web cần kèm theo liên kết đến trang teletrade.vn. Việc tự động thu thập số liệu cũng như thông tin từ trang web TeleTrade đều không được phép.
Xin vui lòng liên hệ với pr@teletrade.global nếu có câu hỏi.
ngân hàng