- Phân tích
- Tin tức và các công cụ
- Tin tức thị trường
- Gold Price Forecast: XAU/USD faces barricades above $1,930 amid hawkish Fed chatters
Gold Price Forecast: XAU/USD faces barricades above $1,930 amid hawkish Fed chatters
- Gold price is struggling to sustain above the immediate resistance of $1.930.00.
- Hawkish commentary from Fed policymakers is strengthening the US Treasury yields.
- According to a Reuters survey, the Fed will pause the policy tightening program after two 25 bps rate hikes.
Gold price (XAU/USD) is witnessing selling pressure in sustaining above the critical resistance of $1,930.00 in the Asian session. The precious metal is struggling to extend gains as hawkish commentaries from various Federal Reserve (Fed) policymakers.
S&P500 futures are trying hard to hold early Asian gains, however, it is difficult to consider it a recovery in the risk-appetite theme. The demand for US government bonds is easing as the Fed is expected to continue higher interest rates for a decent period. The 10-year US Treasury yields have scaled to near 3.42%. Meanwhile, the US Dollar Index (DXY) is displaying a lackluster performance, oscillating in a narrow range above 101.60.
No doubt, the signs of declining inflation through the lens of economic slowdown, decelerating Producer Price Index (PPI) numbers, and weaker retail demand are compelling, but the inflation rate is still extremely far from the 2% inflation target. Therefore, a continuation of the interest rates announcement by the Fed cannot be ruled out.
From the outcome of a survey, Reuters claims that Fed chair Jerome Powell will pause the policy tightening program for the rest of CY2023 after hiking interest rates by 25 basis points (bps) in the next two monetary policy meetings.
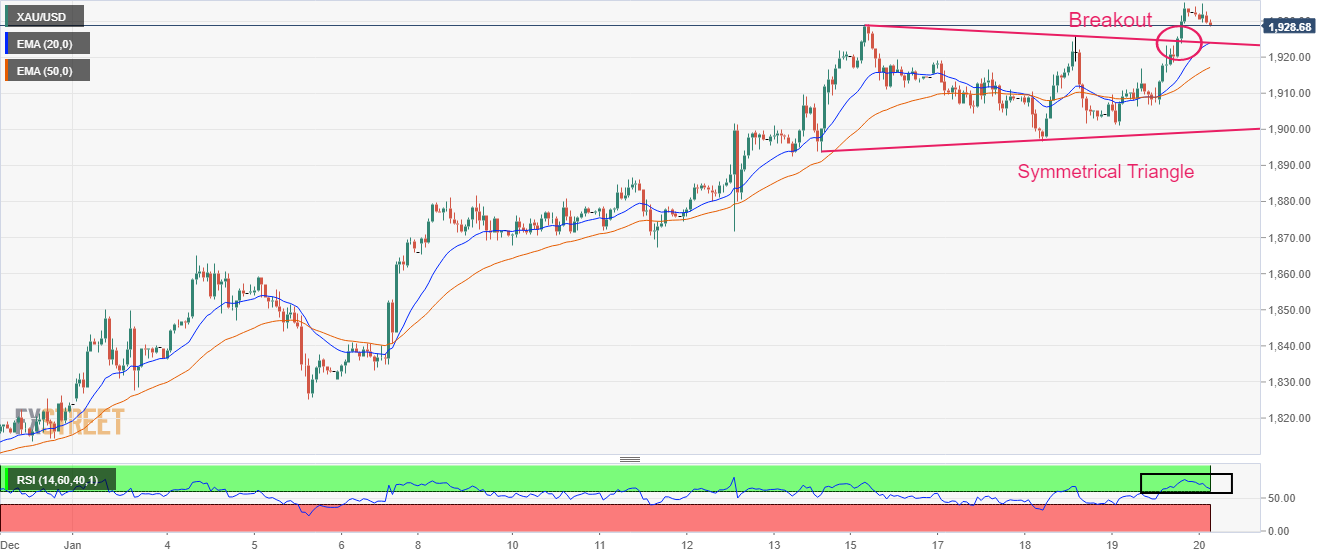
Gold technical analysis
Gold price is set for a fresh upside as the asset has delivered a breakout of the Symmetrical Triangle chart pattern on an hourly scale. The breakout of the volatility contraction chart pattern seems solid as the size of ticks after the breakout was wider than average.
Upward-sloping 20-and 50-period Exponential Moving Averages (EMAs) at $1,923.91 and $1,917.54 respectively, add to the upside filters.
The Relative Strength Index (RSI) (14) is oscillating in a bullish range of 60.00-80.00, which indicates that the upside momentum is active.
Gold hourly chart


© 2000-2026. Bản quyền Teletrade.
Trang web này được quản lý bởi Teletrade D.J. LLC 2351 LLC 2022 (Euro House, Richmond Hill Road, Kingstown, VC0100, St. Vincent and the Grenadines).
Thông tin trên trang web không phải là cơ sở để đưa ra quyết định đầu tư và chỉ được cung cấp cho mục đích làm quen.
Giao dịch trên thị trường tài chính (đặc biệt là giao dịch sử dụng các công cụ biên) mở ra những cơ hội lớn và tạo điều kiện cho các nhà đầu tư sẵn sàng mạo hiểm để thu lợi nhuận, tuy nhiên nó mang trong mình nguy cơ rủi ro khá cao. Chính vì vậy trước khi tiến hành giao dịch cần phải xem xét mọi mặt vấn đề chấp nhận tiến hành giao dịch cụ thể xét theo quan điểm của nguồn lực tài chính sẵn có và mức độ am hiểu thị trường tài chính.
Sử dụng thông tin: sử dụng toàn bộ hay riêng biệt các dữ liệu trên trang web của công ty TeleTrade như một nguồn cung cấp thông tin nhất định. Việc sử dụng tư liệu từ trang web cần kèm theo liên kết đến trang teletrade.vn. Việc tự động thu thập số liệu cũng như thông tin từ trang web TeleTrade đều không được phép.
Xin vui lòng liên hệ với pr@teletrade.global nếu có câu hỏi.
ngân hàng