- Phân tích
- Tin tức và các công cụ
- Tin tức thị trường
- Gold Price Forecast: XAU/USD eyes $1,950 as US Dollar Index cracks, US Q4 GDP eyed
Gold Price Forecast: XAU/USD eyes $1,950 as US Dollar Index cracks, US Q4 GDP eyed
- Gold price is looking to test the $1,950.00 resistance amid volatility in the USD Index.
- A pause in BoC’s policy tightening conveys that major central banks are near to the terminal rate.
- More-than-projected contraction in the US Q4 GDP might accelerate recession fears.
Gold price (XAU/USD) is aiming to test the $1,950.00 resistance for the first time in the past nine months as the US Dollar Index has faced immense pressure. The precious metal displayed a vertical rally after dropping to near $1,920.00amid rising hopes that the Federal Reserve (Fed) has no other option than to announce a smaller interest rate hike ahead. Also, a pause announced in the policy tightening by the Bank of Canada (BoC) has conveyed a message that major central banks have reached to the terminal rate.
The US Dollar Index (DXY) has dropped to near seven-month low of around 101.20 and a downside break will trigger massive selling from the market participants. S&P managed to recover losses, portrayed optimism in the market and dips are being capitalized as a buying opportunity in the risk-perceived assets by the market participants. The 10-year US Treasury yields dropped to 3.44%.
For further guidance, investors will keep an eye on the release of the preliminary United States Gross Domestic Product (GDP) data for the fourth quarter of CY2022. As per the projections, the annualized GDP is seen lower at 2.6% vs. the prior release of 3.2%. An expression of a contraction in overall economic activities might accelerate recession fears on a broader basis.
Gold technical analysis
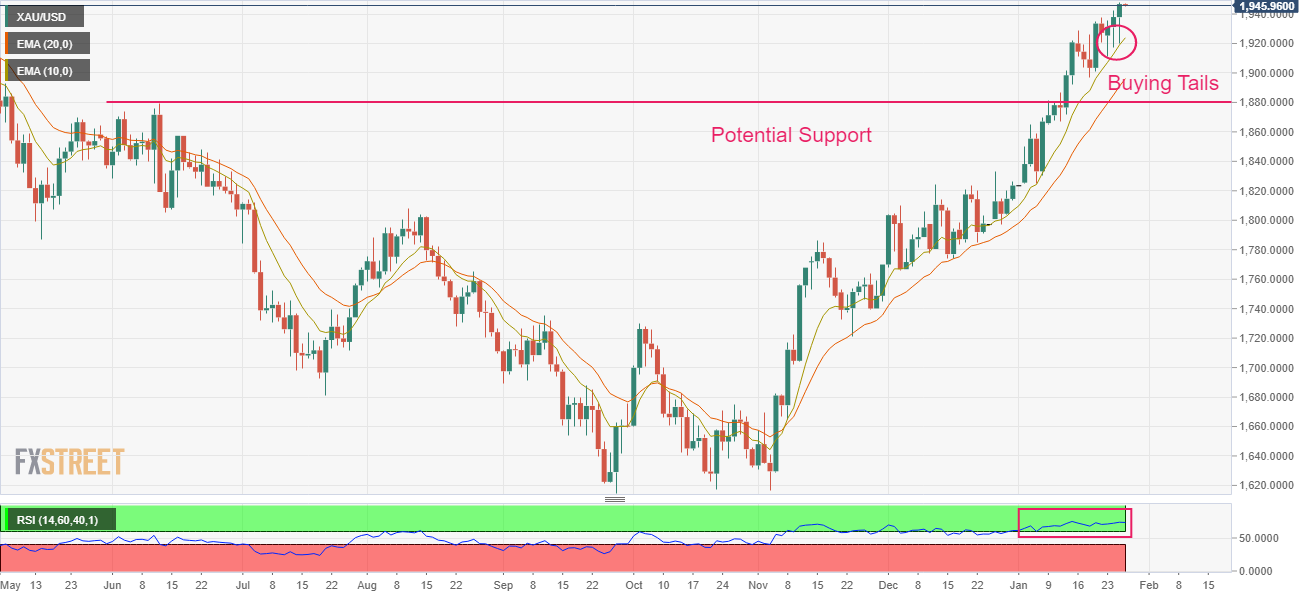
Gold price is in a strong uptrend forming higher highs and higher lows on a daily scale. The precious metal has witnessed three consecutive buying tails, which indicates that the market participants are buying the dips with immense interest. On a broader note, horizontal support plotted from June 13 high at $1,879.26 will be a cushion for the Gold price.
The 10-and 20-period Exponential Moving Averages (EMAs) at $1,924.74 and $1,895.26 respectively are aiming higher, which signals more upside ahead.
Also, the Relative Strength Index (RSI) (14) is oscillating in a bullish range of 60.00-80.00, which indicates that the bullish momentum is active.
Gold daily chart


© 2000-2026. Bản quyền Teletrade.
Trang web này được quản lý bởi Teletrade D.J. LLC 2351 LLC 2022 (Euro House, Richmond Hill Road, Kingstown, VC0100, St. Vincent and the Grenadines).
Thông tin trên trang web không phải là cơ sở để đưa ra quyết định đầu tư và chỉ được cung cấp cho mục đích làm quen.
Giao dịch trên thị trường tài chính (đặc biệt là giao dịch sử dụng các công cụ biên) mở ra những cơ hội lớn và tạo điều kiện cho các nhà đầu tư sẵn sàng mạo hiểm để thu lợi nhuận, tuy nhiên nó mang trong mình nguy cơ rủi ro khá cao. Chính vì vậy trước khi tiến hành giao dịch cần phải xem xét mọi mặt vấn đề chấp nhận tiến hành giao dịch cụ thể xét theo quan điểm của nguồn lực tài chính sẵn có và mức độ am hiểu thị trường tài chính.
Sử dụng thông tin: sử dụng toàn bộ hay riêng biệt các dữ liệu trên trang web của công ty TeleTrade như một nguồn cung cấp thông tin nhất định. Việc sử dụng tư liệu từ trang web cần kèm theo liên kết đến trang teletrade.vn. Việc tự động thu thập số liệu cũng như thông tin từ trang web TeleTrade đều không được phép.
Xin vui lòng liên hệ với pr@teletrade.global nếu có câu hỏi.
ngân hàng