- Phân tích
- Tin tức và các công cụ
- Tin tức thị trường
- Gold Price Forecast: XAU/USD fails to kiss $1,950 as USD Index attempts recovery
Gold Price Forecast: XAU/USD fails to kiss $1,950 as USD Index attempts recovery
- Gold price is struggling to test the $1,950.00 resistance as anxiety soars ahead of the US GDP.
- The USD Index is building a cushion around 101.10 but could deliver a breakdown amid a risk-on mood.
- Rising odds of a smaller interest rate hike by the Fed are weighing down US yields.
Gold price (XAU/USD) has sensed selling pressure while attempting to kiss the critical resistance of $1,950.00. The precious metal is not getting the desired strength required to hit the $1,950.00 hurdle as investors are getting anxious ahead of the release of the United States Gross Domestic Product (GDP) and other critical economic data.
The US Dollar Index (DXY) is constantly grueling to build a cushion around 101.20 despite the upbeat market mood. S&P500 futures are displaying moderate gains, conveying the expression of the solid risk appetite of the market participants. The 10-year US Treasury yields have dropped to near 3.44%.
The street is continuously discussing the chances of a US recession in CY2023 as the Federal Reserve (Fed) has already tightened monetary policy significantly. The release of the US GDP data will provide more clarity about the scales of economic activities in the fourth quarter of CY2022. As per the projections, the US GDP is expected to contract to 2.6% from the former release of 3.2%. More-than-expected contraction in economic activities might bolster the case of a smaller interest rate hike by the Fed.
Gold technical analysis
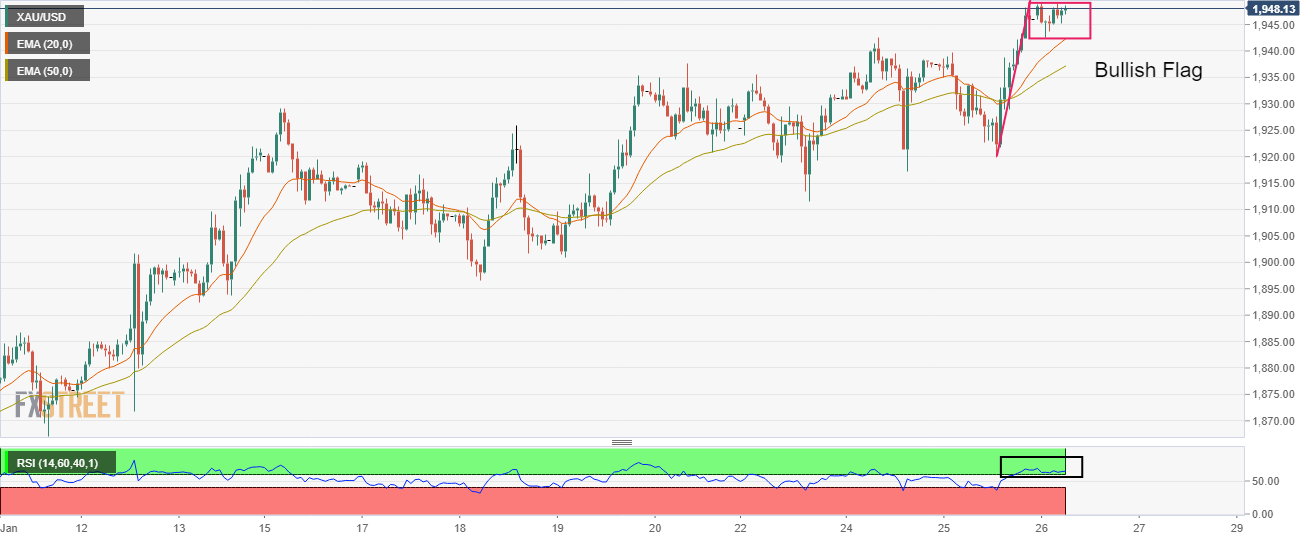
Gold price is forming a Bullish Flag chart pattern on an hourly scale, which indicates a continuation of the bullish momentum after the breakout of a consolidation. Usually, the consolidation phase of the chart pattern serves as an inventory adjustment in which those participants initiate longs, which prefer to enter an auction after the establishment of a bullish bias.
Advancing 20-and 50-period Exponential Moving Averages (EMAs) at $1,942.46 and $1,937.35 respectively add to the upside filters.
The Relative Strength Index (RSI) (14) is oscillating in a bullish range of 60.00-80.00, which indicates more upside ahead.
Gold hourly chart


© 2000-2026. Bản quyền Teletrade.
Trang web này được quản lý bởi Teletrade D.J. LLC 2351 LLC 2022 (Euro House, Richmond Hill Road, Kingstown, VC0100, St. Vincent and the Grenadines).
Thông tin trên trang web không phải là cơ sở để đưa ra quyết định đầu tư và chỉ được cung cấp cho mục đích làm quen.
Giao dịch trên thị trường tài chính (đặc biệt là giao dịch sử dụng các công cụ biên) mở ra những cơ hội lớn và tạo điều kiện cho các nhà đầu tư sẵn sàng mạo hiểm để thu lợi nhuận, tuy nhiên nó mang trong mình nguy cơ rủi ro khá cao. Chính vì vậy trước khi tiến hành giao dịch cần phải xem xét mọi mặt vấn đề chấp nhận tiến hành giao dịch cụ thể xét theo quan điểm của nguồn lực tài chính sẵn có và mức độ am hiểu thị trường tài chính.
Sử dụng thông tin: sử dụng toàn bộ hay riêng biệt các dữ liệu trên trang web của công ty TeleTrade như một nguồn cung cấp thông tin nhất định. Việc sử dụng tư liệu từ trang web cần kèm theo liên kết đến trang teletrade.vn. Việc tự động thu thập số liệu cũng như thông tin từ trang web TeleTrade đều không được phép.
Xin vui lòng liên hệ với pr@teletrade.global nếu có câu hỏi.
ngân hàng