- Phân tích
- Tin tức và các công cụ
- Tin tức thị trường
- AUD/USD Price Analysis: Australian Dollar faces heat as market mood sours
AUD/USD Price Analysis: Australian Dollar faces heat as market mood sours
-
Investors have turned risk-averse ahead of the US PCE Price Index data.
-
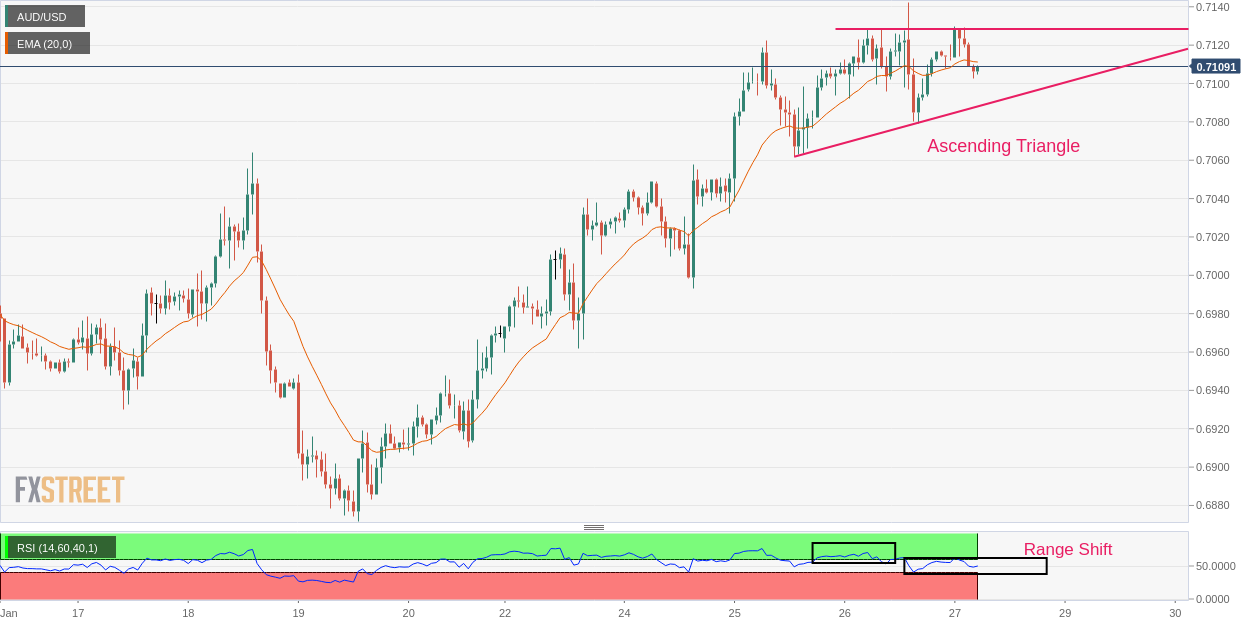
The formation of an Ascending Triangle indicates sheer volatility contraction.
-
The RSI (14) has shifted into the 40.00-60.. range, which indicates an exhaustion in the upside momentum.
The AUD/USD pair has corrected sharply to near 0.7100 in the early European session. The Aussie asset has sensed selling pressure as investors have turned risk averse ahead of the release of the United States Personal Consumption Expenditure (PCE) Price Index data. Meanwhile, an improvement in the safe-haven’s appeal has strengthened the US Dollar Index (DXY).
S&P500 futures has demonstrated a sell-off as further interest rate hikes by the Federal Reserve (Fed) might accelerate recession fears. The 10-year US Treasury yields has added gains further to near 3.53%.
On an hourly scale, AUD/USD is oscillating in an Ascending Triangle chart pattern that indicates a sheer contraction in volatility. The upward-sloping trendline of the chart pattern is plotted from January 25 average price at 0.7061 while the horizontal resistance is placed from January 26 high around 0.7140.
The 20-period Exponential Moving Average (EMA) at 0.7110 has overlapped the asset, which indicates a rangebound acution profile.
It is observed that the Relative Strength Index (RSI) (14) has shifted into the 40.00-60.00 range from the bullish range of 60.00-80.00, which conveys that the bullish momentum has faded now.
Should the asset breaks above January 26 high at 0.7142, Aussie asset will deliver a breakout the Ascending Triangle, which will drive the major towards the round-level resistance of 0.7200. A breach of the latter will expose the asset for more upside toward June 3 high at 0.7283.
On the contrary, a downside move below December 29 low at 0.6710 will drag the major further toward December 22 low at 0.6650 followed by November 21 low at 0.6585.
AUD/USD hourly chart


© 2000-2026. Bản quyền Teletrade.
Trang web này được quản lý bởi Teletrade D.J. LLC 2351 LLC 2022 (Euro House, Richmond Hill Road, Kingstown, VC0100, St. Vincent and the Grenadines).
Thông tin trên trang web không phải là cơ sở để đưa ra quyết định đầu tư và chỉ được cung cấp cho mục đích làm quen.
Giao dịch trên thị trường tài chính (đặc biệt là giao dịch sử dụng các công cụ biên) mở ra những cơ hội lớn và tạo điều kiện cho các nhà đầu tư sẵn sàng mạo hiểm để thu lợi nhuận, tuy nhiên nó mang trong mình nguy cơ rủi ro khá cao. Chính vì vậy trước khi tiến hành giao dịch cần phải xem xét mọi mặt vấn đề chấp nhận tiến hành giao dịch cụ thể xét theo quan điểm của nguồn lực tài chính sẵn có và mức độ am hiểu thị trường tài chính.
Sử dụng thông tin: sử dụng toàn bộ hay riêng biệt các dữ liệu trên trang web của công ty TeleTrade như một nguồn cung cấp thông tin nhất định. Việc sử dụng tư liệu từ trang web cần kèm theo liên kết đến trang teletrade.vn. Việc tự động thu thập số liệu cũng như thông tin từ trang web TeleTrade đều không được phép.
Xin vui lòng liên hệ với pr@teletrade.global nếu có câu hỏi.
ngân hàng