- Phân tích
- Tin tức và các công cụ
- Tin tức thị trường
- Gold Price Forecast: XAU/USD weakness hinges on $1,920 breakdown, Fed’s verdict – Confluence Detector
Gold Price Forecast: XAU/USD weakness hinges on $1,920 breakdown, Fed’s verdict – Confluence Detector
- Gold price retreats from intraday high while paring the first daily gains in three.
- Cautious mood ahead of key data/events challenge XAU/USD traders.
- Softer yields probe US Dollar rebound and Gold bears.
- Multiple technical indicators highlight $1,917-18 as the key support confluence.
Gold price (XAU/USD) stays defensive around $1,930, printing mild gains heading into Monday’s European session, as traders begin the key week comprising the Federal Reserve’s (Fed) monetary policy and the US employment data for January. Adding strength to the cautious optimism of the XAU/USD traders could be China’s return from one-week-long holidays, as well as hopes of a dovish hike from the Fed and downbeat Nonfarm Payrolls (NFP).
It’s worth noting that a slower start to the key week comprising a heavy load of economics also seems to underpin the corrective bounce of the Gold prices from a short-term key support confluence. That said, the metal’s short-term moves depend upon how well the Fed manages to push back the dovish bias despite confirming the nearness to the policy pivot.
Also read: Gold Price Forecast: XAU/USD shows resilience below 200-hour SMA, bulls have the upper hand
Gold Price: Key levels to watch
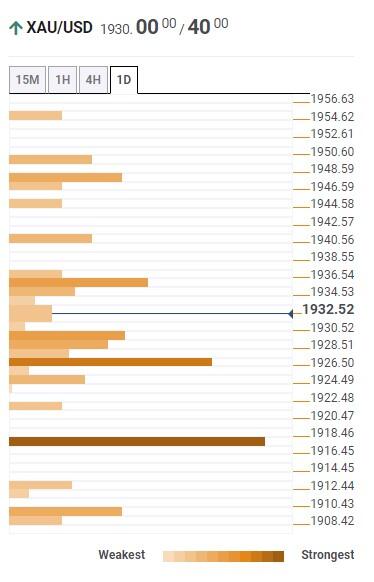
The Technical Confluence Detector shows that the Gold price grinds higher past $1,918-17 support confluence, comprising the previous daily low, Pivot Point One Month R3 and Pivot Point One-day S1.
Ahead of that, the Fibonacci 61.8% on one-week joins 10-DMA to offer immediate support to the XAU/USD around $1,927.
That said, the $1,900 round figure appears the likely target for the Gold bears once they manage to conquer the $1,917 support.
On the contrary, Pivot Point one-day R1, Fibonacci 38.2% on one-week and previous daily high challenges short-term Gold buyers around $1,937.
In a case where XAU/USD remains firmer past $1,937, Pivot Point one week R1 and Fibonacci 161.8% on one day could challenge the Gold buyers around $1,950 level.
Here is how it looks on the tool
About Technical Confluences Detector
The TCD (Technical Confluences Detector) is a tool to locate and point out those price levels where there is a congestion of indicators, moving averages, Fibonacci levels, Pivot Points, etc. If you are a short-term trader, you will find entry points for counter-trend strategies and hunt a few points at a time. If you are a medium-to-long-term trader, this tool will allow you to know in advance the price levels where a medium-to-long-term trend may stop and rest, where to unwind positions, or where to increase your position size.


© 2000-2026. Bản quyền Teletrade.
Trang web này được quản lý bởi Teletrade D.J. LLC 2351 LLC 2022 (Euro House, Richmond Hill Road, Kingstown, VC0100, St. Vincent and the Grenadines).
Thông tin trên trang web không phải là cơ sở để đưa ra quyết định đầu tư và chỉ được cung cấp cho mục đích làm quen.
Giao dịch trên thị trường tài chính (đặc biệt là giao dịch sử dụng các công cụ biên) mở ra những cơ hội lớn và tạo điều kiện cho các nhà đầu tư sẵn sàng mạo hiểm để thu lợi nhuận, tuy nhiên nó mang trong mình nguy cơ rủi ro khá cao. Chính vì vậy trước khi tiến hành giao dịch cần phải xem xét mọi mặt vấn đề chấp nhận tiến hành giao dịch cụ thể xét theo quan điểm của nguồn lực tài chính sẵn có và mức độ am hiểu thị trường tài chính.
Sử dụng thông tin: sử dụng toàn bộ hay riêng biệt các dữ liệu trên trang web của công ty TeleTrade như một nguồn cung cấp thông tin nhất định. Việc sử dụng tư liệu từ trang web cần kèm theo liên kết đến trang teletrade.vn. Việc tự động thu thập số liệu cũng như thông tin từ trang web TeleTrade đều không được phép.
Xin vui lòng liên hệ với pr@teletrade.global nếu có câu hỏi.
ngân hàng