- Phân tích
- Tin tức và các công cụ
- Tin tức thị trường
- Gold Price Forecast: XAU/USD traders focus on $1,950 and Fed decision – Confluence Detector
Gold Price Forecast: XAU/USD traders focus on $1,950 and Fed decision – Confluence Detector
- Gold price struggles to extend the previous day’s corrective bounce as sellers have the upper hand below $1,950 hurdle.
- Pre-Fed anxiety probe XAU/USD moves but fading inflation woes in the US, softer yields tease buyers.
- Mixed data from China, recession concerns keep Gold bears hopeful.
- Fed Chair Powell’s press conference will be crucial as 0.25% rate hike is priced in.
Gold price (XAU/USD) portrays the typical pre-Fed anxiety as it seesaws around $1,928 during early Wednesday. The yellow metal dropped to the lowest levels in a week the previous day before bouncing off the $1,900 threshold as downbeat US data underpinned dovish expectations from today’s Federal Open Market Committee (FOMC) monetary policy meeting. Adding strength to the bullion was the upbeat performance of the US equities amid strong earnings from top-tier companies. It’s worth noting, however, that the market’s fears of recession and Fed Chair Jerome Powell’s hawkish nature seem to probe the XAU/USD buyers of late. Additionally, China’s consecutive sixth monthly contraction in the Caixin Manufacturing PMI also seems to challenge the bullion prices ahead of the activity data from the UK, Europe and the US, not to forget the Fed’s verdict.
Also read: Gold Price Forecast: Tensions mount ahead of Fed, buyers keep defending $1,900
Gold Price: Key levels to watch
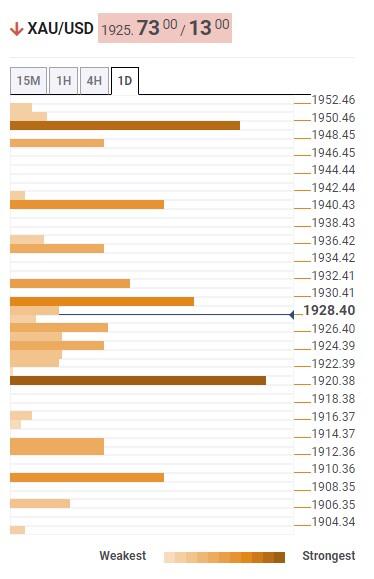
The Technical Confluence Detector shows that the Gold price grinds higher past the $1,920 support confluence, comprising Fibonacci 38.2% on one day and 23.6% on one month.
Also acting as a downside filter is the convergence of the Pivot Point one week and one day S1 near $1,907, a break of which could quickly drag the quote to the previous day’s bottom surrounding the $1,900 threshold.
Meanwhile, $1,930 guards the Gold price’s immediate upside as it encompasses the previous high and 50-SMA on four-hour (4H), as well as the 200-HMA.
Following that, Pivot Point one day R1 and Fibonacci 23.6% on one week join the upper band of Bollinger to highlight $1,940 as an intermediate hurdle.
Above all, the $1,950 level comprising previous monthly and weekly highs, as well as the Pivot Point one day R2, appears a tough nut to crack for the Gold buyers, a break of which could quickly propel prices towards March 2022 peak surrounding $1,966.
Overall, the Gold price grinds higher but the road towards the north appears long and bumpy.
Here is how it looks on the tool
About Technical Confluences Detector
The TCD (Technical Confluences Detector) is a tool to locate and point out those price levels where there is a congestion of indicators, moving averages, Fibonacci levels, Pivot Points, etc. If you are a short-term trader, you will find entry points for counter-trend strategies and hunt a few points at a time. If you are a medium-to-long-term trader, this tool will allow you to know in advance the price levels where a medium-to-long-term trend may stop and rest, where to unwind positions, or where to increase your position size.


© 2000-2026. Bản quyền Teletrade.
Trang web này được quản lý bởi Teletrade D.J. LLC 2351 LLC 2022 (Euro House, Richmond Hill Road, Kingstown, VC0100, St. Vincent and the Grenadines).
Thông tin trên trang web không phải là cơ sở để đưa ra quyết định đầu tư và chỉ được cung cấp cho mục đích làm quen.
Giao dịch trên thị trường tài chính (đặc biệt là giao dịch sử dụng các công cụ biên) mở ra những cơ hội lớn và tạo điều kiện cho các nhà đầu tư sẵn sàng mạo hiểm để thu lợi nhuận, tuy nhiên nó mang trong mình nguy cơ rủi ro khá cao. Chính vì vậy trước khi tiến hành giao dịch cần phải xem xét mọi mặt vấn đề chấp nhận tiến hành giao dịch cụ thể xét theo quan điểm của nguồn lực tài chính sẵn có và mức độ am hiểu thị trường tài chính.
Sử dụng thông tin: sử dụng toàn bộ hay riêng biệt các dữ liệu trên trang web của công ty TeleTrade như một nguồn cung cấp thông tin nhất định. Việc sử dụng tư liệu từ trang web cần kèm theo liên kết đến trang teletrade.vn. Việc tự động thu thập số liệu cũng như thông tin từ trang web TeleTrade đều không được phép.
Xin vui lòng liên hệ với pr@teletrade.global nếu có câu hỏi.
ngân hàng