- Phân tích
- Tin tức và các công cụ
- Tin tức thị trường
- WTI Price Analysis: Bulls pile it on in $75.00 target area, focus is on Asian highs guarding $77.70
WTI Price Analysis: Bulls pile it on in $75.00 target area, focus is on Asian highs guarding $77.70
- WTI dropped to the %75s and now the daily chart shows the price breaking the trendline support.
- WTI, however, is now correcting higher to $76.70 resistance.
- The $77.70s are eyed as a 61.8% ratio target.
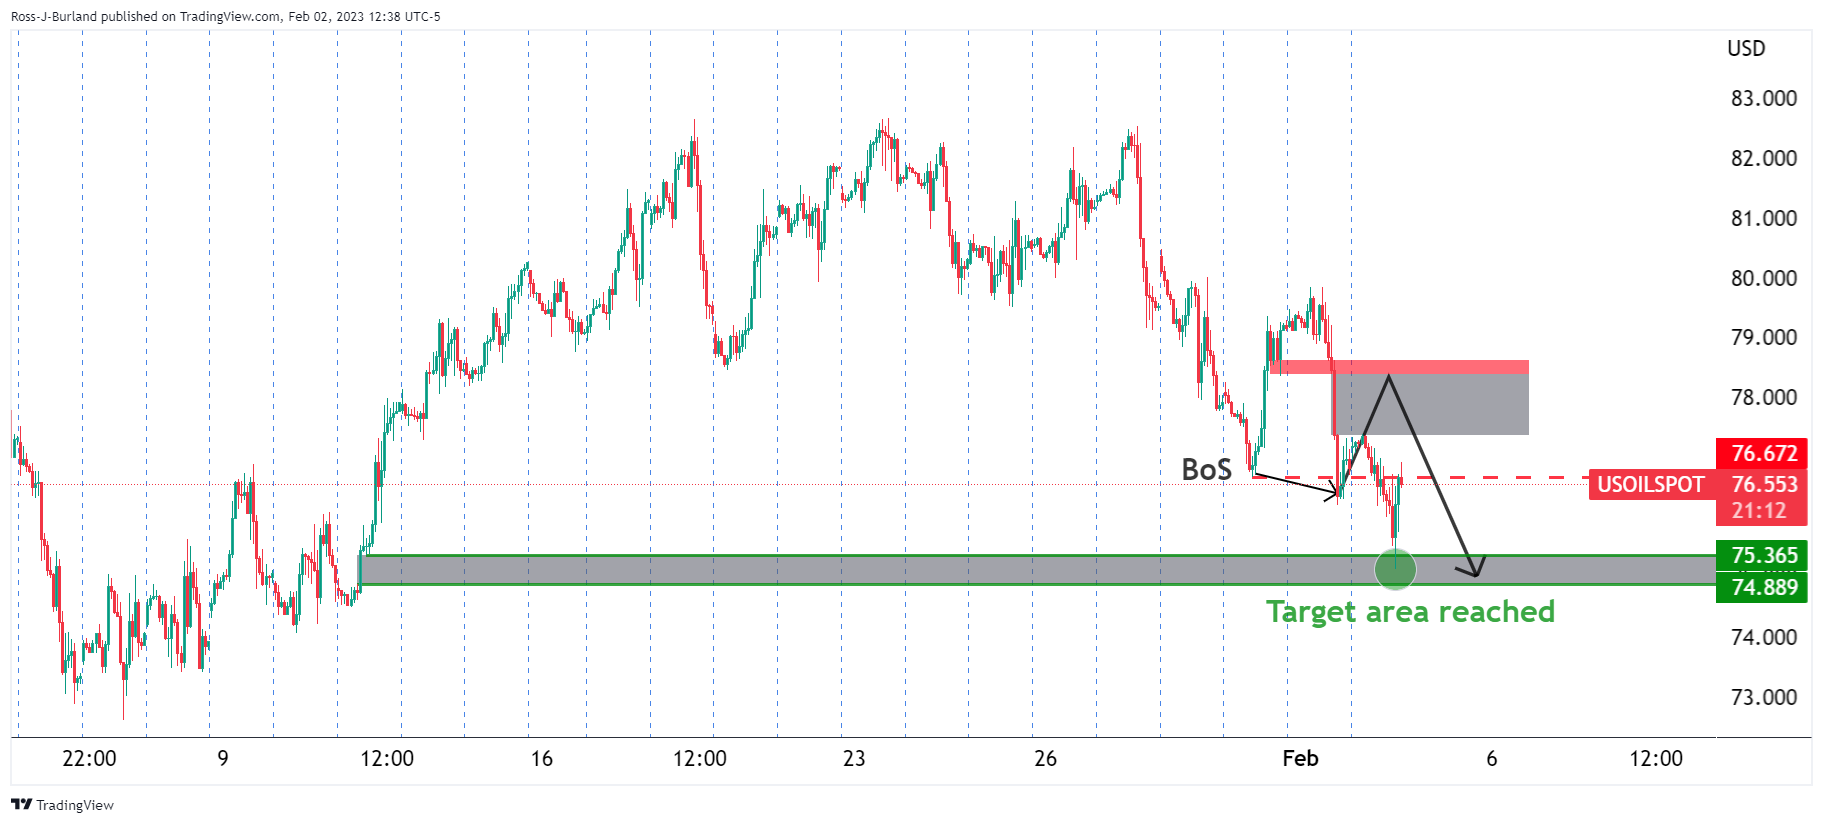
As per the prior analysis of the week, targetting the $75s target area, the objective was reached in the New york equities cash opening window with heightened volatility. The focus is now on the upside as the bulls move in for the kill to sweep the buy liquidity with a focus on the Asian highs that guard the price imbalances above. Targets are placed around $77.50 (50% mean reversion area), $77.70 (Mondayinitial balance lows) and a 61.8% Fibonacci retracement of the latest bearish impulse around $78.80 as the following analysis illustrates.
WTI, prior analysis
WTI bears taking control into the Fed, eyes on $75.00bbl
WTI Price Analysis: Bears break key hourly structure, eye $75.00bbls
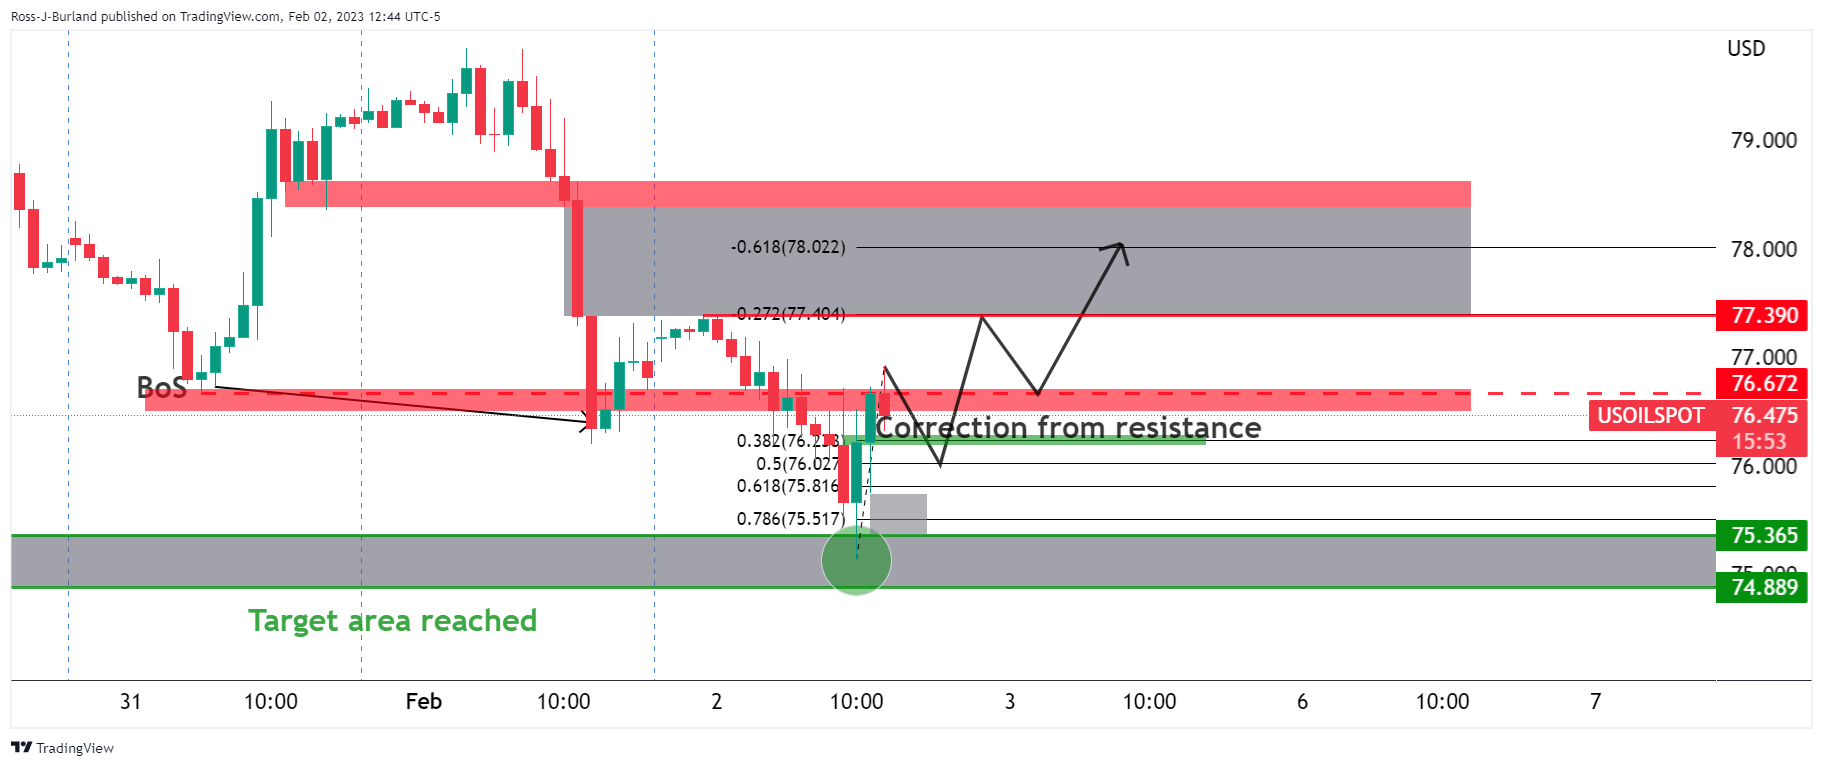
It was suggested that ''a correction into resistance could entice trapped longs to get out of losing or breakeven positions and subsequently the shorts coming onto the market around 38.2% Fibonacci correction could see a move out of the consolidation below the trapped volume and into a 100% measured target towards $75.00 over the course of the coming week.''
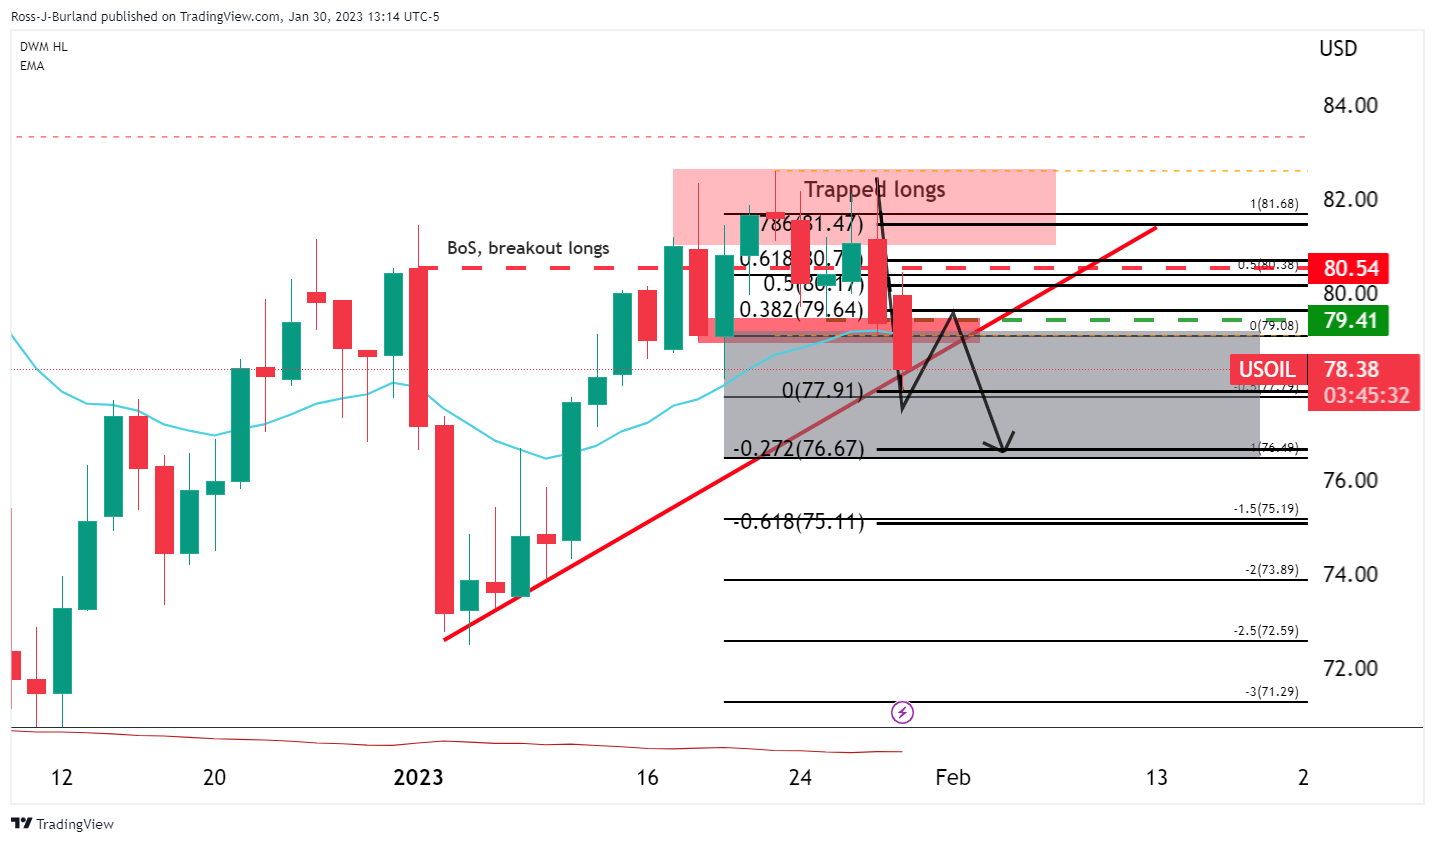
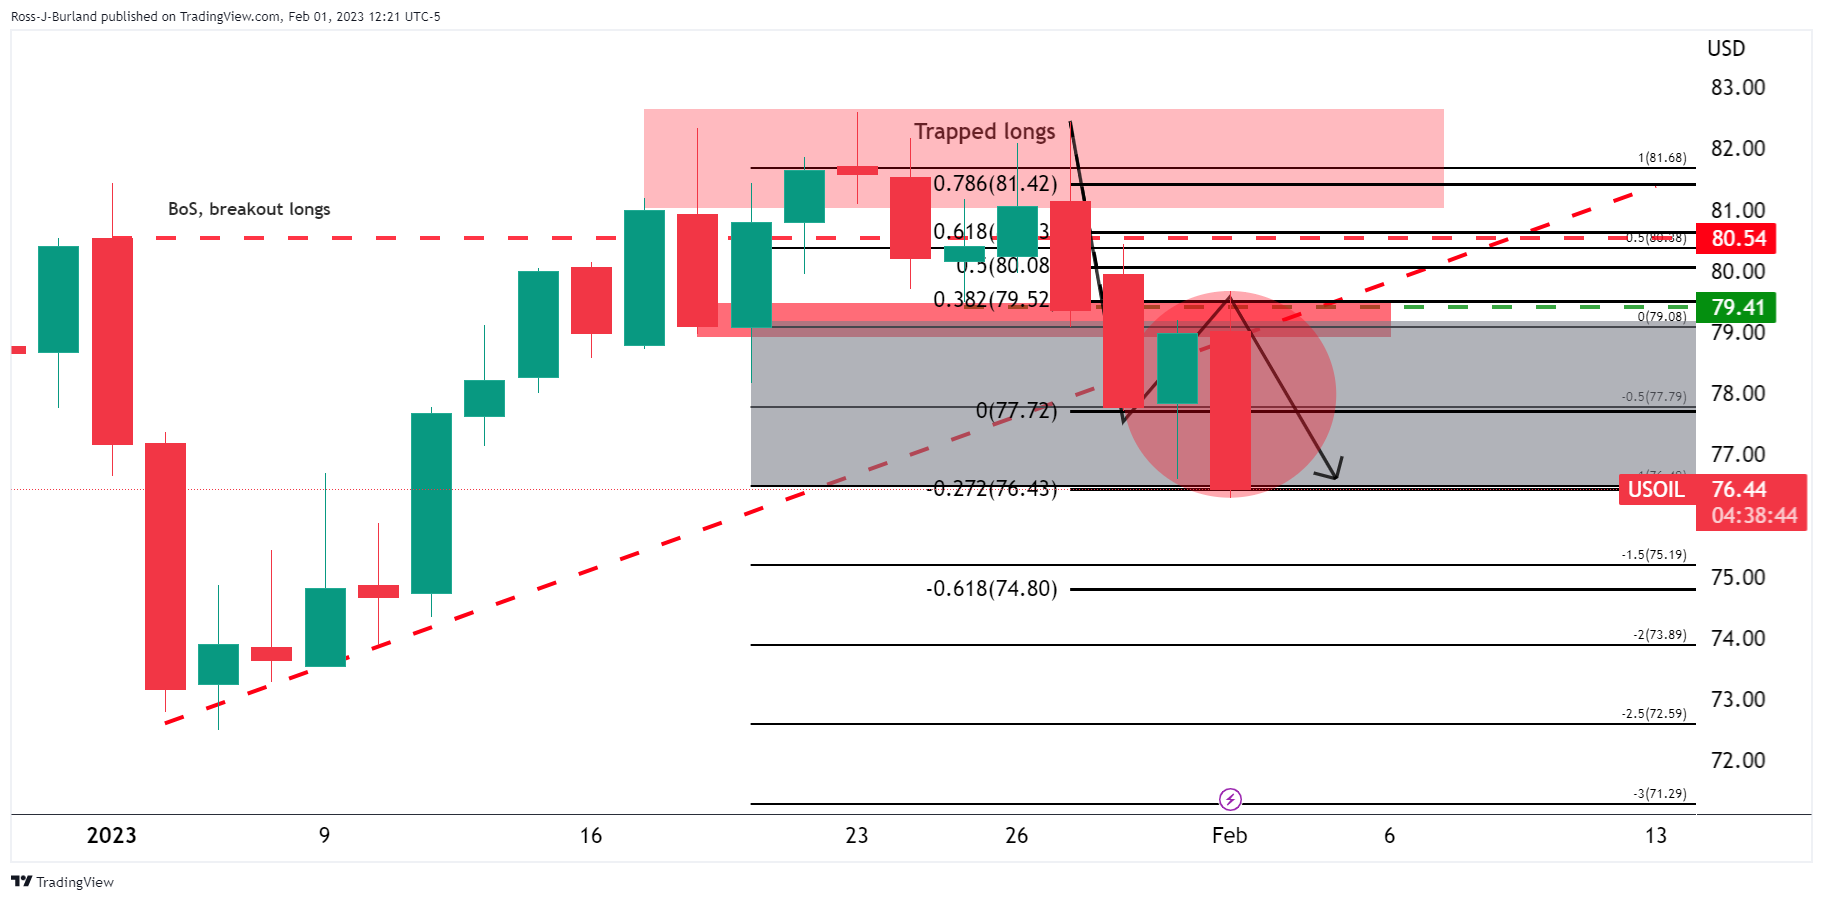
As illustrated, the price sank into the target area following a correction into where shorts were looking to get in at a premium. The subsequent move had fulfilled the 100% measured move and $75.00 was beckoning:
WTI H1 charts, prior analysis
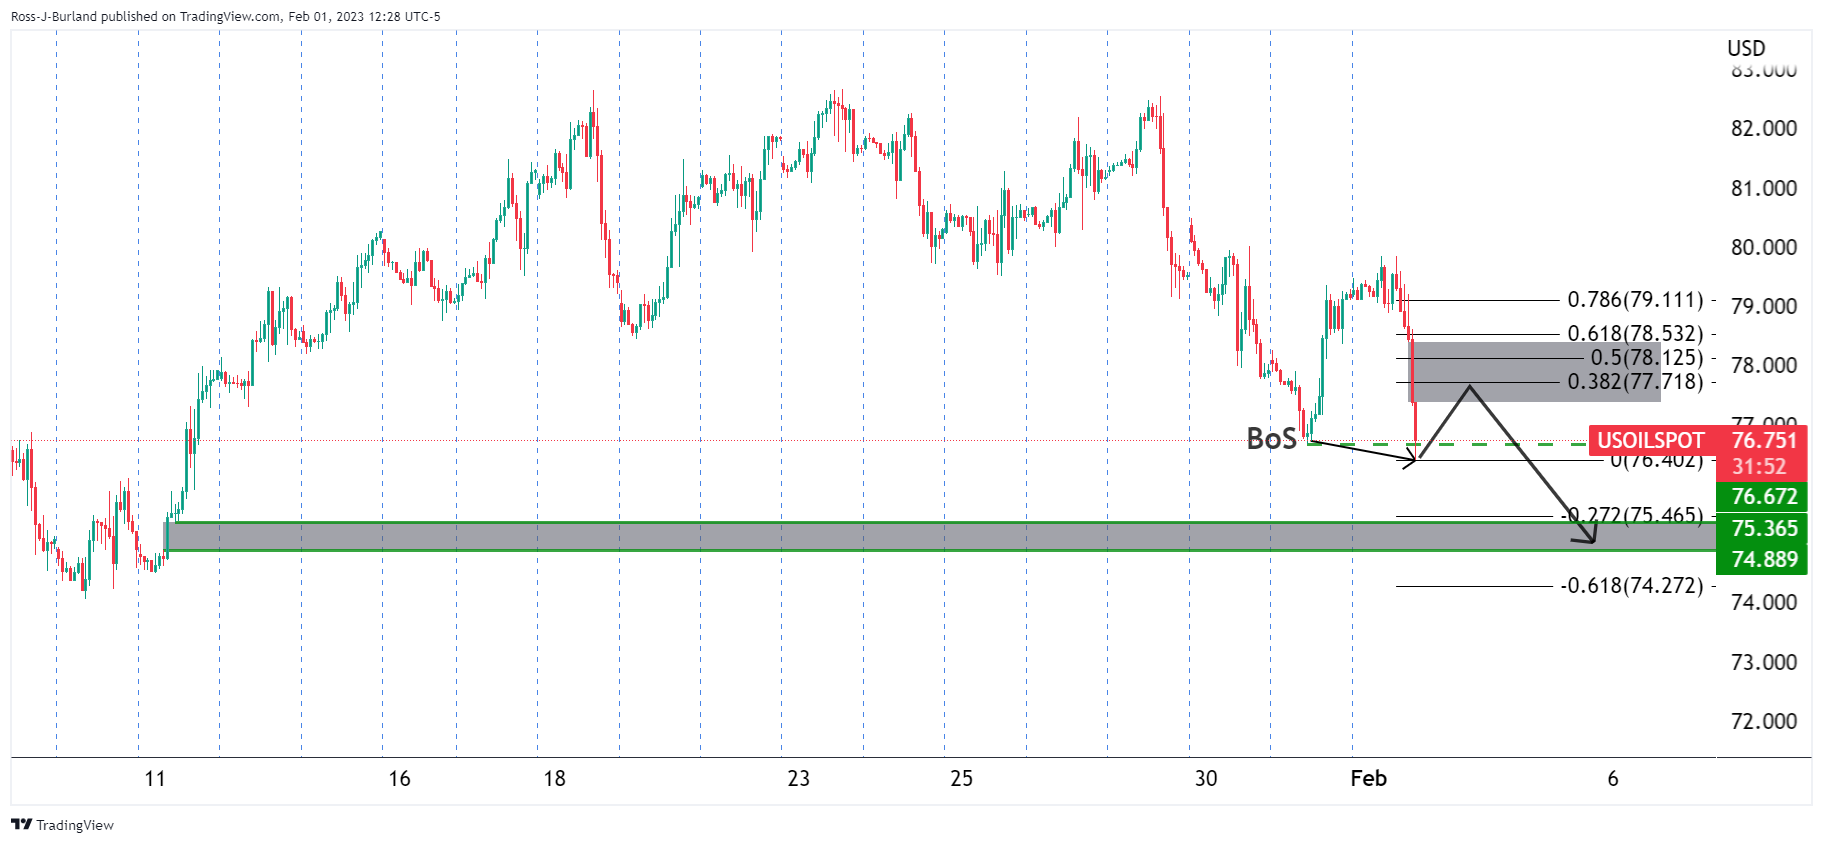
Zoomed in ...
The greyed areas were price imbalances while the red marking was a resistance zone that had a confluence with the 61.8% Fibonacci retracement level near $78.50. While below there, the bias was to the downside.
However, a more shallow correction may be all that was needed. Either way, bears were looking to target between $75.36 and $74.88 on a break of $75.50.
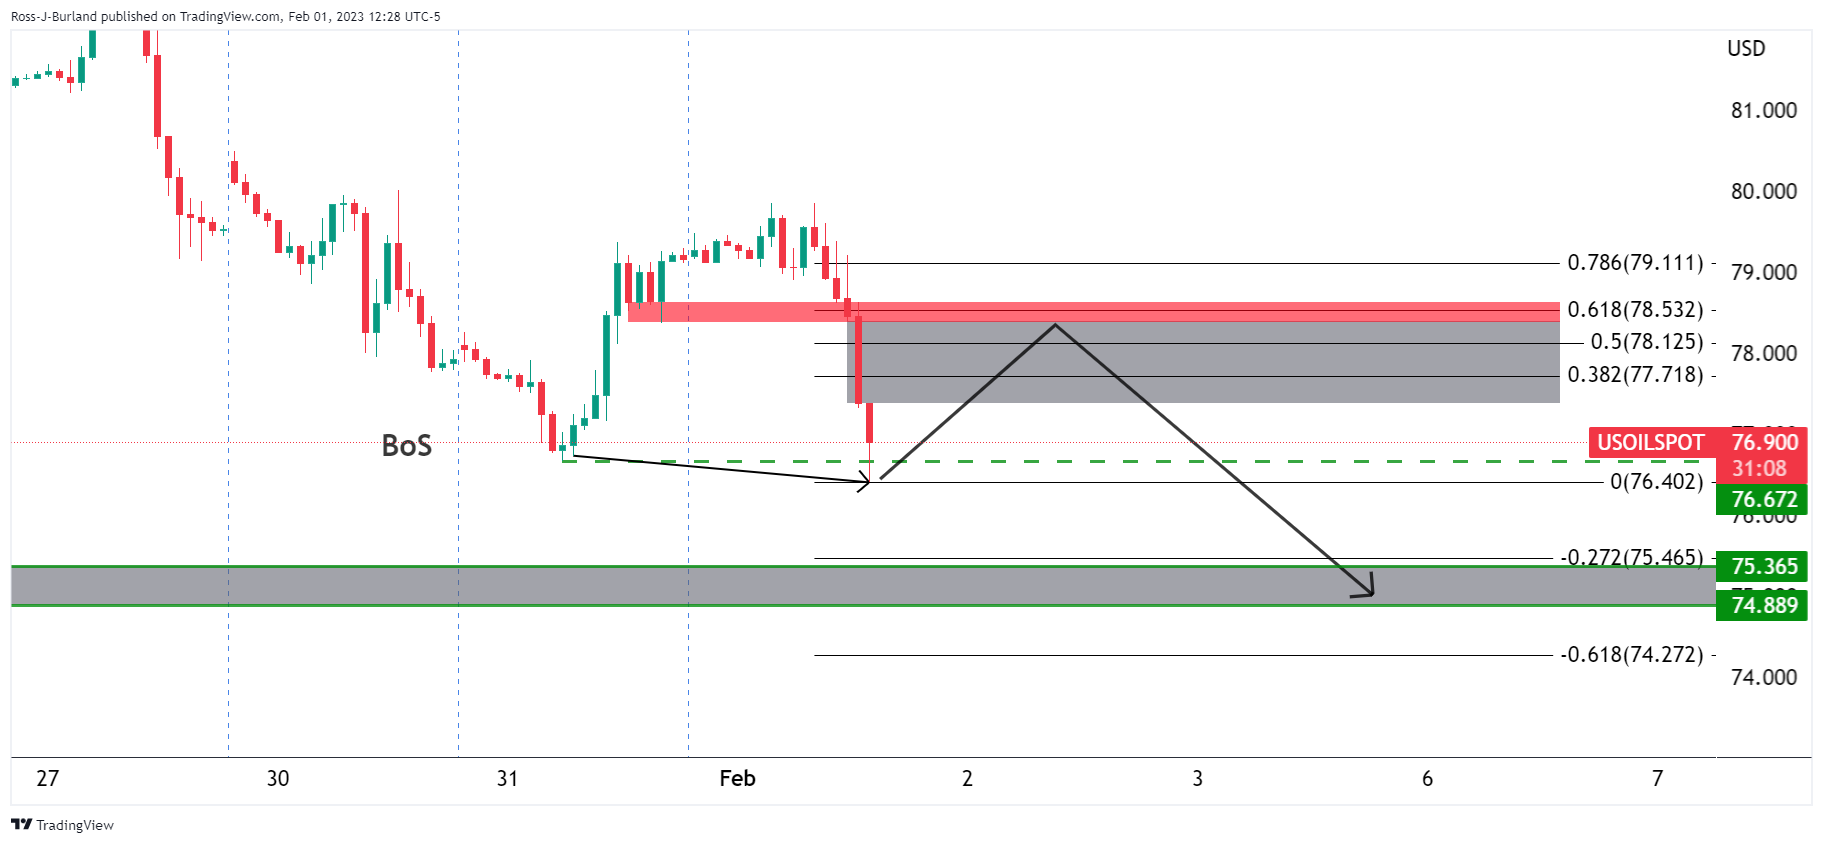
WTI Update
The price has reached the resistance and a correction is underway.
WTI daily and M15 charts
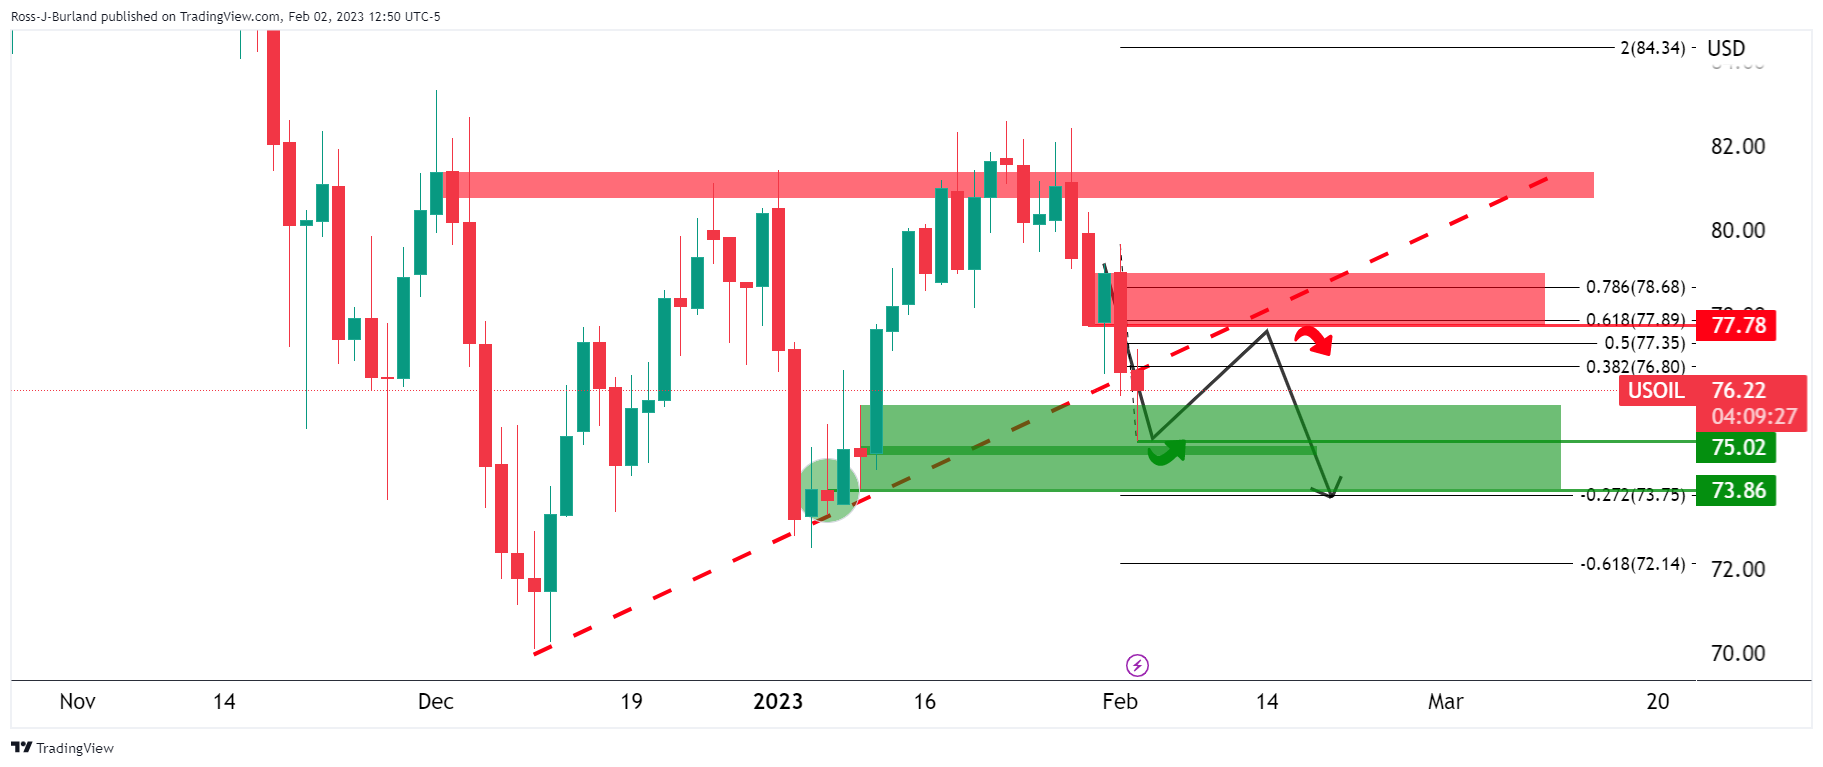
The daily chart shows the price breaking the trendline support but meeting horizontal support and correcting. If this is the start of a daily correction, then the $77.70s are eyed in a 61.8% ratio of the bearish impulse.
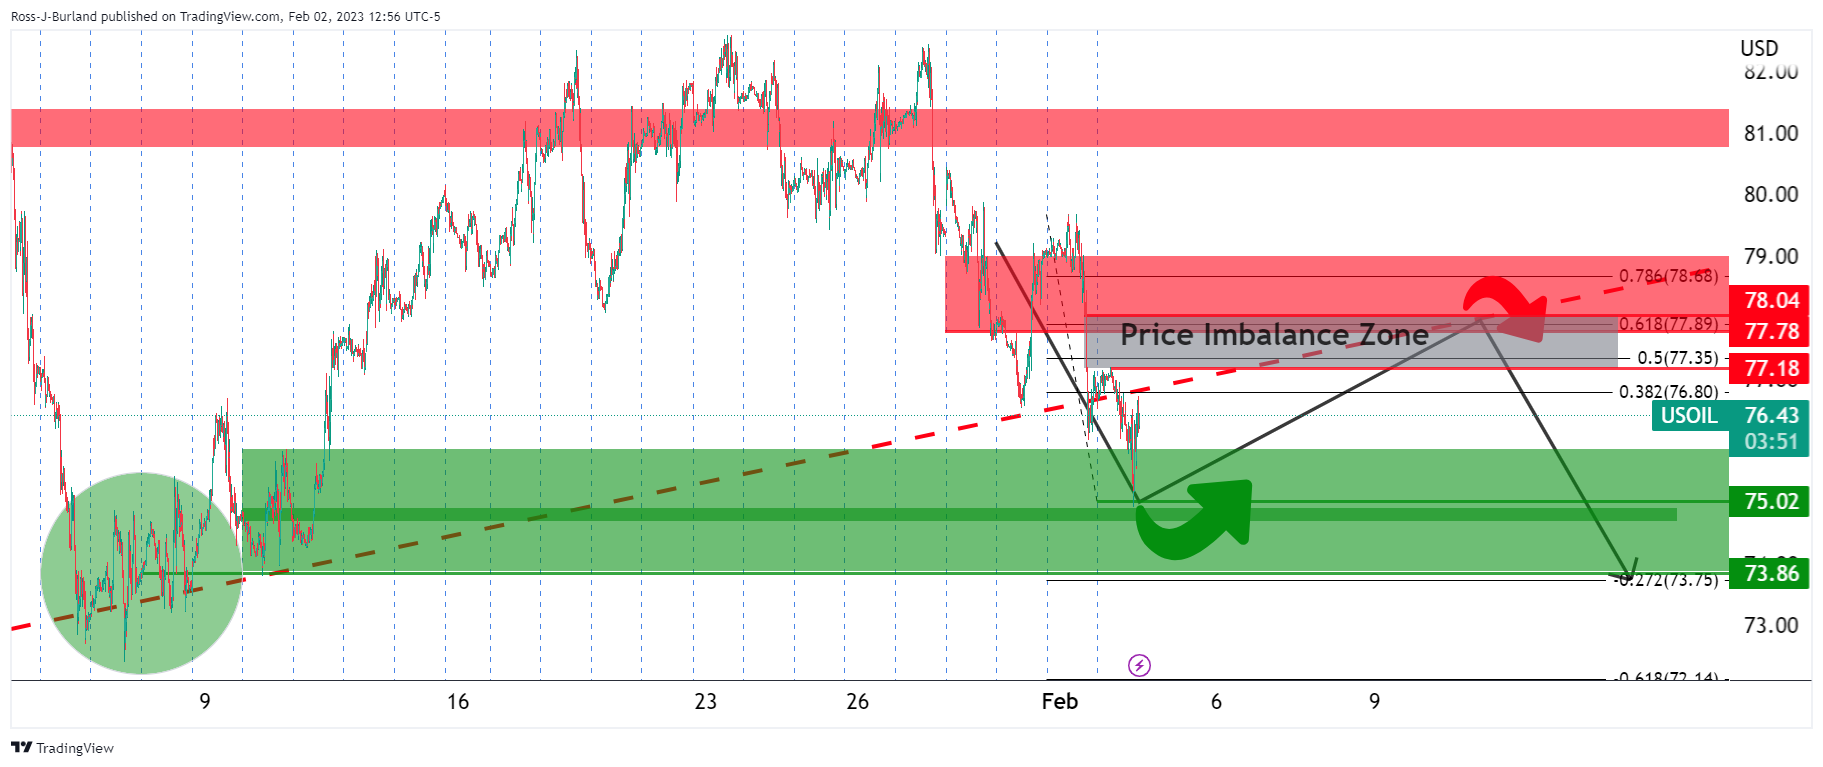
Moving down to the 15-minute chart we can see a price imbalance between $77.18 and $78.04 for the bulls to target:


© 2000-2026. Bản quyền Teletrade.
Trang web này được quản lý bởi Teletrade D.J. LLC 2351 LLC 2022 (Euro House, Richmond Hill Road, Kingstown, VC0100, St. Vincent and the Grenadines).
Thông tin trên trang web không phải là cơ sở để đưa ra quyết định đầu tư và chỉ được cung cấp cho mục đích làm quen.
Giao dịch trên thị trường tài chính (đặc biệt là giao dịch sử dụng các công cụ biên) mở ra những cơ hội lớn và tạo điều kiện cho các nhà đầu tư sẵn sàng mạo hiểm để thu lợi nhuận, tuy nhiên nó mang trong mình nguy cơ rủi ro khá cao. Chính vì vậy trước khi tiến hành giao dịch cần phải xem xét mọi mặt vấn đề chấp nhận tiến hành giao dịch cụ thể xét theo quan điểm của nguồn lực tài chính sẵn có và mức độ am hiểu thị trường tài chính.
Sử dụng thông tin: sử dụng toàn bộ hay riêng biệt các dữ liệu trên trang web của công ty TeleTrade như một nguồn cung cấp thông tin nhất định. Việc sử dụng tư liệu từ trang web cần kèm theo liên kết đến trang teletrade.vn. Việc tự động thu thập số liệu cũng như thông tin từ trang web TeleTrade đều không được phép.
Xin vui lòng liên hệ với pr@teletrade.global nếu có câu hỏi.
ngân hàng