- Phân tích
- Tin tức và các công cụ
- Tin tức thị trường
- Gold Price Forecast: XAU/USD could see a bumpy road to recovery toward $1,930 – Confluence Detector
Gold Price Forecast: XAU/USD could see a bumpy road to recovery toward $1,930 – Confluence Detector
- Gold price is licking its wounds amid a broad United States Dollar rebound.
- Dovish Fed expectations, weak US Treasury bond yields could limit Gold’s downside.
- Gold traders await Friday’s US NFP and Fed Powell’s speech next week for fresh cues.
Gold price (XAU/USD) is defending a minor bid, staying calm after two back-to-back days of intense volatility, steered by the major central banks’ policy decisions. The US Dollar is holding onto its recovery momentum after reaching the lowest level in ten months on the dovish Federal Reserve outcome. Disappointing earnings reports from the American tech giants, Apple Inc., Amazon.com Inc. and Google parent Alphabet Inc., have unnerved markets and lifted the US Dollar demand across the board. The persistent weakness in the US Treasury bond yields, however, is lending support to the Gold price. The focus now shifts toward Friday’s US labor market report and Fed Chair Jerome Powell’s speech scheduled next week for a fresh direction in the Gold price.
Also read: US January Nonfarm Payrolls Preview: Analyzing Gold price's reaction to NFP surprises
Gold Price: Key levels to watch
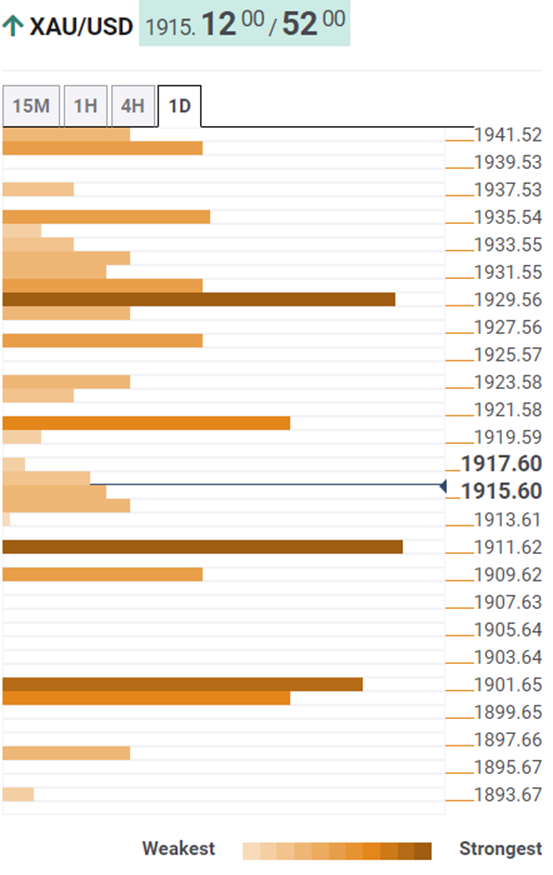
The Technical Confluence Detector shows that the Gold price is defending strong support aligned at $1,910, where the previous day’s low and the previous week’s low coincide.
A sustained move below the latter will fuel a sharp drop toward the $1,901 level, which is the convergence of the Fibonacci 38.2% one-month and the Bollinger Band four-hour Lower.
Should the downside extend Gold sellers will threaten the pivot point one-day S1 at $1,896.
Alternatively, the immediate resistance is seen at the Fibonacci 23.6% one-month at $1,920, above which the Fibonacci 23.6% one-day at $1,923 will be tested.
The next critical upside barrier is placed at around $1,929, which is the intersection of the SMA5 one-day, Fibonacci 38.2% one-day and the SMA100 on-hour.
Gold bulls need to find a strong foothold above that key hurdle to resume their journey toward the multi-month high of $1,960.
Here is how it looks on the tool
About Technical Confluences Detector
The TCD (Technical Confluences Detector) is a tool to locate and point out those price levels where there is a congestion of indicators, moving averages, Fibonacci levels, Pivot Points, etc. If you are a short-term trader, you will find entry points for counter-trend strategies and hunt a few points at a time. If you are a medium-to-long-term trader, this tool will allow you to know in advance the price levels where a medium-to-long-term trend may stop and rest, where to unwind positions, or where to increase your position size.


© 2000-2026. Bản quyền Teletrade.
Trang web này được quản lý bởi Teletrade D.J. LLC 2351 LLC 2022 (Euro House, Richmond Hill Road, Kingstown, VC0100, St. Vincent and the Grenadines).
Thông tin trên trang web không phải là cơ sở để đưa ra quyết định đầu tư và chỉ được cung cấp cho mục đích làm quen.
Giao dịch trên thị trường tài chính (đặc biệt là giao dịch sử dụng các công cụ biên) mở ra những cơ hội lớn và tạo điều kiện cho các nhà đầu tư sẵn sàng mạo hiểm để thu lợi nhuận, tuy nhiên nó mang trong mình nguy cơ rủi ro khá cao. Chính vì vậy trước khi tiến hành giao dịch cần phải xem xét mọi mặt vấn đề chấp nhận tiến hành giao dịch cụ thể xét theo quan điểm của nguồn lực tài chính sẵn có và mức độ am hiểu thị trường tài chính.
Sử dụng thông tin: sử dụng toàn bộ hay riêng biệt các dữ liệu trên trang web của công ty TeleTrade như một nguồn cung cấp thông tin nhất định. Việc sử dụng tư liệu từ trang web cần kèm theo liên kết đến trang teletrade.vn. Việc tự động thu thập số liệu cũng như thông tin từ trang web TeleTrade đều không được phép.
Xin vui lòng liên hệ với pr@teletrade.global nếu có câu hỏi.
ngân hàng