- Phân tích
- Tin tức và các công cụ
- Tin tức thị trường
- Gold Price Forecast: XAU/USD bulls need validation from $1,905 – Confluence Detector
Gold Price Forecast: XAU/USD bulls need validation from $1,905 – Confluence Detector
- Gold price improves from one-month low amid sluggish US Dollar.
- China-linked risk-aversion, Fed concerns and $1,903 resistance confluence challenges XAU/USD rebound.
- Fed Chair Powell’s speech, US data eyed for clear directions after Friday’s upbeat data renewed hawkish Fed bias.
Gold price (XAU/USD) rebounds from monthly low, grinding higher around intraday tops surrounding $1,878 heading into Monday’s European session. In doing so, the yellow metal snaps a two-day downtrend amid the sluggish US Dollar, despite the sour sentiment and hawkish Fed sentiment.
Friday’s upbeat US jobs report and ISM Services PMI renewed chatters that the Federal Reserve (Fed) has some room to increase the rates. That said, the US shooting of a Chinese balloon and canceling Beijing’s visit of Antony Blinken, US Secretary of State, weigh on the market’s risk profile. On the same line was China’s warning to not aggravate the tense situation while also terming the incident as an ‘obvious overreaction’.
The US Dollar Index (DXY) remains inactive even as the US Treasury bond yields rebound and stock futures print mild losses. The reason could be linked to the DXY bull’s indecision ahead of Tuesday’s speech from Fed Chair Jerome Powell.
Also read: Gold Price Forecast: XAU/USD rebounds but not out of the woods yet
Gold Price: Key levels to watch
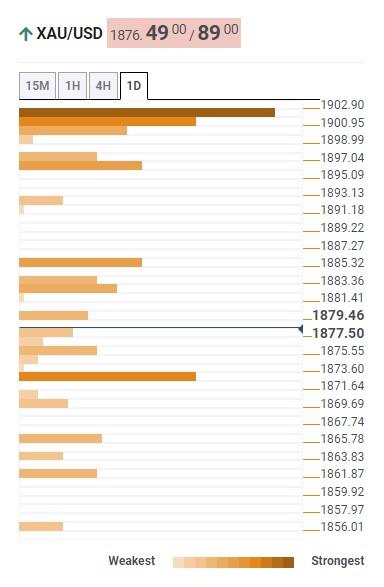
The Technical Confluence Detector shows that the Gold price grinds higher towards the key resistance confluence comprising the Fibonacci 38.2% on one month and Pivot Point one day R1, around $1,903.
Before that, Fibonacci 61.8% on one day could challenge the Gold buyers around $1,897.
On an immediate basis, Fibonacci 23.6% on one week guards the XAU/USD upside around $1,885.
Meanwhile, Fibonacci 61.8% on one month, close to $1,870, puts a floor under the Gold price.
In a case where XAU/USD remains weak past $1,870, it’s downturn towards the previous monthly low surrounding $1,825 can’t be ruled out.
Overall, the Gold price remains bearish unless staying below $1,905.
Here is how it looks on the tool
About Technical Confluences Detector
The TCD (Technical Confluences Detector) is a tool to locate and point out those price levels where there is a congestion of indicators, moving averages, Fibonacci levels, Pivot Points, etc. If you are a short-term trader, you will find entry points for counter-trend strategies and hunt a few points at a time. If you are a medium-to-long-term trader, this tool will allow you to know in advance the price levels where a medium-to-long-term trend may stop and rest, where to unwind positions, or where to increase your position size.


© 2000-2026. Bản quyền Teletrade.
Trang web này được quản lý bởi Teletrade D.J. LLC 2351 LLC 2022 (Euro House, Richmond Hill Road, Kingstown, VC0100, St. Vincent and the Grenadines).
Thông tin trên trang web không phải là cơ sở để đưa ra quyết định đầu tư và chỉ được cung cấp cho mục đích làm quen.
Giao dịch trên thị trường tài chính (đặc biệt là giao dịch sử dụng các công cụ biên) mở ra những cơ hội lớn và tạo điều kiện cho các nhà đầu tư sẵn sàng mạo hiểm để thu lợi nhuận, tuy nhiên nó mang trong mình nguy cơ rủi ro khá cao. Chính vì vậy trước khi tiến hành giao dịch cần phải xem xét mọi mặt vấn đề chấp nhận tiến hành giao dịch cụ thể xét theo quan điểm của nguồn lực tài chính sẵn có và mức độ am hiểu thị trường tài chính.
Sử dụng thông tin: sử dụng toàn bộ hay riêng biệt các dữ liệu trên trang web của công ty TeleTrade như một nguồn cung cấp thông tin nhất định. Việc sử dụng tư liệu từ trang web cần kèm theo liên kết đến trang teletrade.vn. Việc tự động thu thập số liệu cũng như thông tin từ trang web TeleTrade đều không được phép.
Xin vui lòng liên hệ với pr@teletrade.global nếu có câu hỏi.
ngân hàng