- Phân tích
- Tin tức và các công cụ
- Tin tức thị trường
- USD/JPY Price Analysis: Bullish momentum remains as a falling wedge forms
USD/JPY Price Analysis: Bullish momentum remains as a falling wedge forms
- The USD/JPY 1-hour chart portrays the formation of a bullish continuation chart pattern, keeping bulls hopeful of higher prices.
- USD/JPY Price Analysis: Long-term is still downward biased unless it breaks resistance around 133.00.
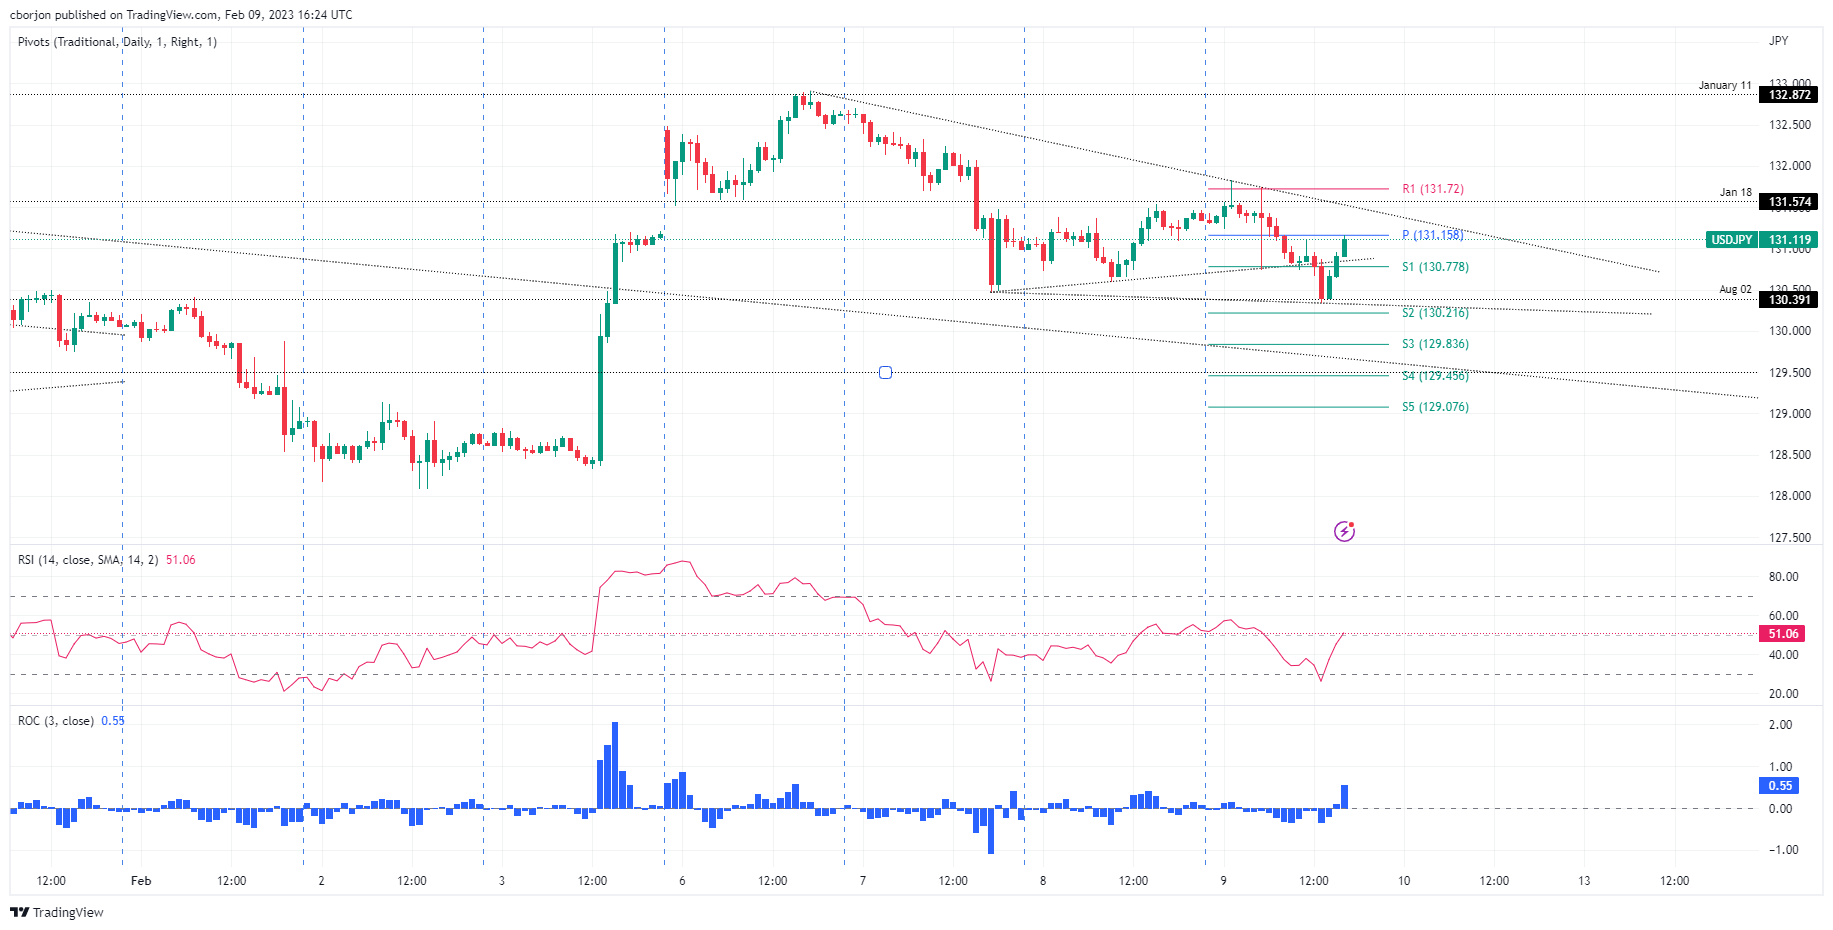
The USD/JPY erases Wednesday’s gains and aims toward the lows of the 130.30-132.90 range during the North American session, eyeing a break below the 20-day Exponential Moving Average (EMA) at 130.66. At the time of writing, the USD/JPY exchanges hands at 131.11, below its opening price by 0.18%.
From a daily chart perspective, the USD/JPY remains downward biased, though it has been tracking the 20-day EMA during the last three days, unable to breach the 130.00 mark. Oscillators like the Relative Strength Index (RSI) and the Rate of Change (RoC) suggest a bearish continuation. But the Bank of Japan’s (BoJ) dovish stance kept market participants from committing to short positions.
In the near term, the USD/JPY one-hour chart portrays the formation of a falling wedge, suggesting a bullish continuation, which could lift prices towards 131.60 and the January 11 high at 132.87. Albeit the Relative Strength Index (RSI) aims upward, it remains in bearish territory, with its slope shifting flat, but the Rate of Change (RoC) depicts buyers gathering momentum. Hence, mixed signals suggest caution is warranted.
USD/JPY buyers need to reclaim 131.82, Thursday’s high. Once done, that would pave the way towards 132.00, 132.87, and the psychological 133.00 barrier. As an alternate scenario, the bearish continuation would resume if the falling wedge breaks downwards. Therefore, the USD/JPY first support would be 130.34, February 9 low. The break below will expose the S2 and S3 daily pivot points, each at 130.21 and 129.83.
USD/JPY One-hour chart
USD/JPY key technical levels


© 2000-2026. Bản quyền Teletrade.
Trang web này được quản lý bởi Teletrade D.J. LLC 2351 LLC 2022 (Euro House, Richmond Hill Road, Kingstown, VC0100, St. Vincent and the Grenadines).
Thông tin trên trang web không phải là cơ sở để đưa ra quyết định đầu tư và chỉ được cung cấp cho mục đích làm quen.
Giao dịch trên thị trường tài chính (đặc biệt là giao dịch sử dụng các công cụ biên) mở ra những cơ hội lớn và tạo điều kiện cho các nhà đầu tư sẵn sàng mạo hiểm để thu lợi nhuận, tuy nhiên nó mang trong mình nguy cơ rủi ro khá cao. Chính vì vậy trước khi tiến hành giao dịch cần phải xem xét mọi mặt vấn đề chấp nhận tiến hành giao dịch cụ thể xét theo quan điểm của nguồn lực tài chính sẵn có và mức độ am hiểu thị trường tài chính.
Sử dụng thông tin: sử dụng toàn bộ hay riêng biệt các dữ liệu trên trang web của công ty TeleTrade như một nguồn cung cấp thông tin nhất định. Việc sử dụng tư liệu từ trang web cần kèm theo liên kết đến trang teletrade.vn. Việc tự động thu thập số liệu cũng như thông tin từ trang web TeleTrade đều không được phép.
Xin vui lòng liên hệ với pr@teletrade.global nếu có câu hỏi.
ngân hàng