- Phân tích
- Tin tức và các công cụ
- Tin tức thị trường
- GBP/USD Price Analysis: A breakout of triangle looks likely amid positive market impulse
GBP/USD Price Analysis: A breakout of triangle looks likely amid positive market impulse
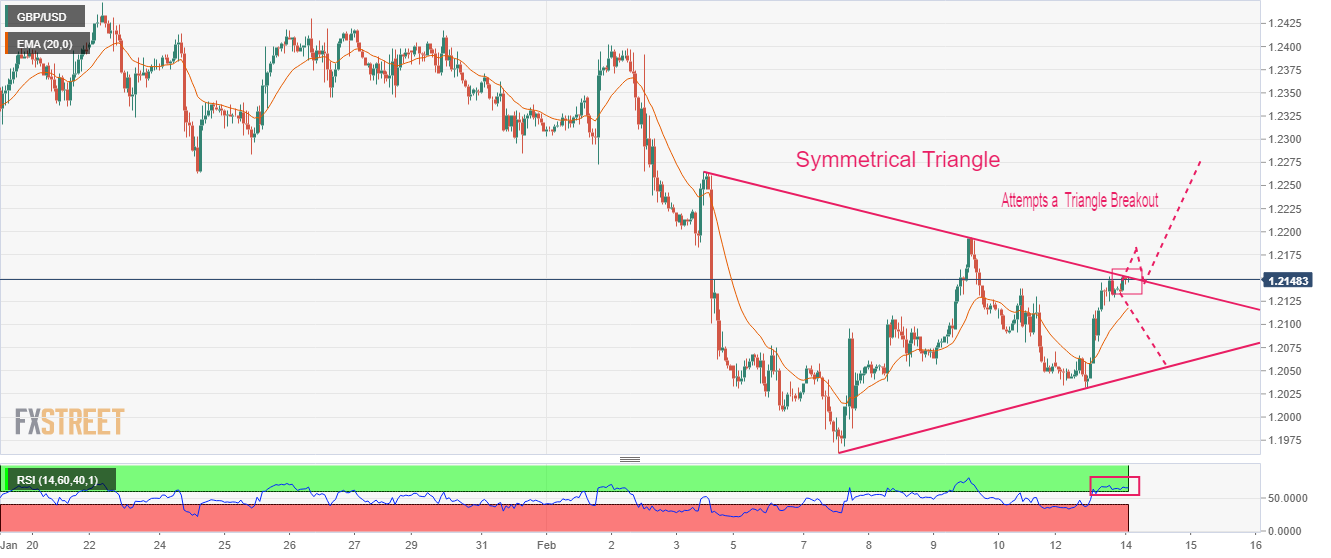
- GBP/USD is hovering near the edge of the Symmetrical Triangle pattern for a breakout.
- Economic events such as the US Inflation and the UK employment data might keep Cable volatile.
- The RSI (14) is oscillating in the bullish range of 60.00-80.00, which indicates that the upside momentum is already active.
The GBP/USD pair has refreshed its day’s high above the critical resistance of 1.2150 in the Asian session. The Cable has picked strength amid the improved risk appetite of investors after they digested the United States inflation-inspired anxiety.
S&P500 futures are displaying a subdued performance after a bullish Monday, portraying a minor caution amid overall positive sentiment. The US Dollar Index (DXY) has further dropped below 102.85, showing a sheer decline in the safe-haven’s appeal. The Pound Sterling will display a power-pack action after the release of the United Kingdom employment data.
GBP/USD is hovering near the edge of the Symmetrical Triangle chart pattern formed on an hourly scale. The upward-sloping trendline of the aforementioned chart pattern is placed from February 7 low at 1.1961 while the downward-sloping trendline is plotted from February 3 high at 1.2264.
Advancing 20-period Exponential Moving Average (EMA) at 1.2118, adds to the upside filters.
The Relative Strength Index (RSI) (14) is oscillating in the bullish range of 60.00-80.00, which indicates that the upside momentum is already active.
A confident breakout of the Symmetrical Triangle above February 9 high at 1.2192 will trigger the volatility expansion, which will drive the asset toward February 3 high at 1.2264. A breach of the latter will expose the asset to the round-level resistance of 1.2300.
On the contrary, a decline in the Cable below February 9 low at 1.2057 will drag the asset toward January 3 low at 1.1900 followed by horizontal support placed from January 6 low around 1.1841.
GBP/USD hourly chart


© 2000-2026. Bản quyền Teletrade.
Trang web này được quản lý bởi Teletrade D.J. LLC 2351 LLC 2022 (Euro House, Richmond Hill Road, Kingstown, VC0100, St. Vincent and the Grenadines).
Thông tin trên trang web không phải là cơ sở để đưa ra quyết định đầu tư và chỉ được cung cấp cho mục đích làm quen.
Giao dịch trên thị trường tài chính (đặc biệt là giao dịch sử dụng các công cụ biên) mở ra những cơ hội lớn và tạo điều kiện cho các nhà đầu tư sẵn sàng mạo hiểm để thu lợi nhuận, tuy nhiên nó mang trong mình nguy cơ rủi ro khá cao. Chính vì vậy trước khi tiến hành giao dịch cần phải xem xét mọi mặt vấn đề chấp nhận tiến hành giao dịch cụ thể xét theo quan điểm của nguồn lực tài chính sẵn có và mức độ am hiểu thị trường tài chính.
Sử dụng thông tin: sử dụng toàn bộ hay riêng biệt các dữ liệu trên trang web của công ty TeleTrade như một nguồn cung cấp thông tin nhất định. Việc sử dụng tư liệu từ trang web cần kèm theo liên kết đến trang teletrade.vn. Việc tự động thu thập số liệu cũng như thông tin từ trang web TeleTrade đều không được phép.
Xin vui lòng liên hệ với pr@teletrade.global nếu có câu hỏi.
ngân hàng