- Phân tích
- Tin tức và các công cụ
- Tin tức thị trường
- Gold Price Forecast: XAU/USD rebound appears elusive below $1,880 – Confluence Detector
Gold Price Forecast: XAU/USD rebound appears elusive below $1,880 – Confluence Detector
- Gold price picks up bids to extend the bounce off six-week low.
- XAU/USD grinds higher as hawkish Fed bets fail to gain acceptance amid softer US inflation.
- Multiple hurdles stand tall to challenge XAU/USD run-up, bears need validation from $1,850.
- Second-tier US data, central bank comments eyed for more directions.
Gold price (XAU/USD) renews its intraday high near $1,860, following a bounce off a 1.5-month low, as market players react to the softer US inflation data during early Wednesday. That said, the yellow metal witnessed a volatile Tuesday but ended up with 0.04% intraday gains as the Federal Reserve (Fed) officials reiterated their hawkish bias despite the lowest US Consumer Price Index (CPI) increase since 2021. Also likely to have probed the Gold buyers previously were the upbeat US Treasury bond yields and the rebound in the US Dollar.
However, a retreat in the benchmark US bond coupons from the monthly highs joins fresh doubts on the hawkish Fed bets to underpin the latest Gold price recovery. Moving on, US Retail Sales and Industrial Production details for January, as well as NY Empire State Manufacturing Index for February and Fed talks, should be watched closely for clear directions.
Also read: Gold Price Forecast: XAU/USD eyes further downside on hawkish Federal Reserve talks
Gold Price: Key levels to watch
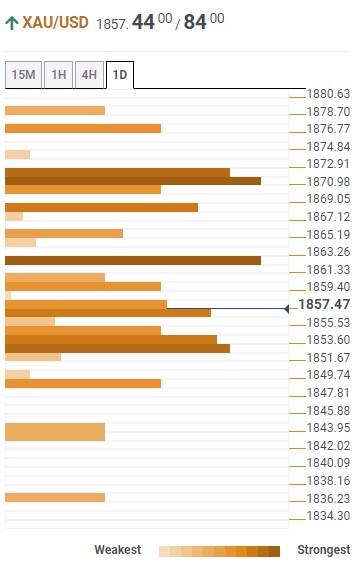
The Technical Confluence Detector shows that the Gold price appears stuck inside a jungle of technical levels on both sides, despite the latest recovery moves from the immediate key support surrounding $1,851, which includes Pivot Point one month S1, previously weekly low and four-hour bottom.
That said, Fibonacci 23.6% on one-week joins the 5-DMA to guard the XAU/USD’s immediate upside near $1,863.
Following that, Fibonacci 61.8% on one month joins Pivot Point one-day R1 and 50-Hour Moving Average (HMA) to highlight $1,872 as the key upside hurdle.
It’s worth observing that the Fibonacci 61.8% on weekly, close to $1,877, acts as the last defense of the Gold bears.
On the flip side, a break below the $1,851 support will need validation from the $1,848 mark comprising the Pivot Point one-week S1 to validate the Gold price south-run.
Here is how it looks on the tool
About Technical Confluences Detector
The TCD (Technical Confluences Detector) is a tool to locate and point out those price levels where there is a congestion of indicators, moving averages, Fibonacci levels, Pivot Points, etc. If you are a short-term trader, you will find entry points for counter-trend strategies and hunt a few points at a time. If you are a medium-to-long-term trader, this tool will allow you to know in advance the price levels where a medium-to-long-term trend may stop and rest, where to unwind positions, or where to increase your position size.


© 2000-2026. Bản quyền Teletrade.
Trang web này được quản lý bởi Teletrade D.J. LLC 2351 LLC 2022 (Euro House, Richmond Hill Road, Kingstown, VC0100, St. Vincent and the Grenadines).
Thông tin trên trang web không phải là cơ sở để đưa ra quyết định đầu tư và chỉ được cung cấp cho mục đích làm quen.
Giao dịch trên thị trường tài chính (đặc biệt là giao dịch sử dụng các công cụ biên) mở ra những cơ hội lớn và tạo điều kiện cho các nhà đầu tư sẵn sàng mạo hiểm để thu lợi nhuận, tuy nhiên nó mang trong mình nguy cơ rủi ro khá cao. Chính vì vậy trước khi tiến hành giao dịch cần phải xem xét mọi mặt vấn đề chấp nhận tiến hành giao dịch cụ thể xét theo quan điểm của nguồn lực tài chính sẵn có và mức độ am hiểu thị trường tài chính.
Sử dụng thông tin: sử dụng toàn bộ hay riêng biệt các dữ liệu trên trang web của công ty TeleTrade như một nguồn cung cấp thông tin nhất định. Việc sử dụng tư liệu từ trang web cần kèm theo liên kết đến trang teletrade.vn. Việc tự động thu thập số liệu cũng như thông tin từ trang web TeleTrade đều không được phép.
Xin vui lòng liên hệ với pr@teletrade.global nếu có câu hỏi.
ngân hàng