- Phân tích
- Tin tức và các công cụ
- Tin tức thị trường
- Gold Price Forecast: XAU/USD bears keep the reins below $1,845 – Confluence Detector
Gold Price Forecast: XAU/USD bears keep the reins below $1,845 – Confluence Detector
- Gold bears flirt with intraday low during two-day losing streak, fades Friday’s bounce off seven-week low.
- Sour sentiment, full markets underpin US Dollar rebound and weigh on XAU/USD amid firmer yields.
- Global PMIs, Fed Minutes eyed for clear directions amid bearish bias.
Gold price (XAU/USD) retreats towards the previous weekly low, also the lowest since late December, as risk aversion joins the return of full markets to underpin the US Dollar. Adding strength to the greenback, as well as weighing on the XAU/USD, could be the upbeat US Treasury bond yields.
That said, geopolitical fears surrounding China and Russia seem to propel the latest rush toward risk safety. On the same line are fresh concerns over the Federal Reserve's (Fed) hawkish move, following the strong US data. It’s worth noting, however, that the cautious mood ahead of the preliminary readings of the US Purchasing Managers Index (PMI) data for February seems to challenge the Gold price. Also important is Wednesday’s Federal Open Market Committee’s (FOMC) Monetary Policy Meeting Minutes.
In addition to the cautious mood and fears of higher Fed rate, technical confluence also keeps Gold bears hopeful.
Also read: Gold Price Forecast: XAU/USD sellers lurk at $1,850, downside remains favored
Gold Price: Key levels to watch
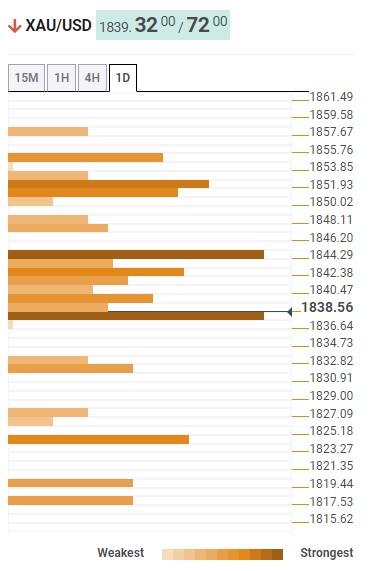
The Technical Confluence Detector shows that the Gold price attacks the short-term key support near $1,837, comprising Pivot Point one day S1, 50-HMA and previous lows on the four-hour, one-hour and one-day.
That said, the metal’s latest weakness could be linked to the pullback from another key technical level, namely $1,845 that comprises Fibonacci 61.8% one-day, previous high on four-hour and the upper Bollinger on 15-minutes.
Also acting as a short-term important resistance is the 200-HMA, Pivot Point one-day R2 and Pivot Point one-month S1, close to $1,852.
Meanwhile, the Gold price weakness below the immediate $1,837 support has an open space towards the south unless hitting the previous monthly low surrounding $1,825.
Following that, the previous weekly low and Pivot Point one week S1 could entertain the XAU/USD bears around $1,819-17 before highlighting the $1,800 threshold.
Here is how it looks on the tool
About Technical Confluences Detector
The TCD (Technical Confluences Detector) is a tool to locate and point out those price levels where there is a congestion of indicators, moving averages, Fibonacci levels, Pivot Points, etc. If you are a short-term trader, you will find entry points for counter-trend strategies and hunt a few points at a time. If you are a medium-to-long-term trader, this tool will allow you to know in advance the price levels where a medium-to-long-term trend may stop and rest, where to unwind positions, or where to increase your position size.


© 2000-2026. Bản quyền Teletrade.
Trang web này được quản lý bởi Teletrade D.J. LLC 2351 LLC 2022 (Euro House, Richmond Hill Road, Kingstown, VC0100, St. Vincent and the Grenadines).
Thông tin trên trang web không phải là cơ sở để đưa ra quyết định đầu tư và chỉ được cung cấp cho mục đích làm quen.
Giao dịch trên thị trường tài chính (đặc biệt là giao dịch sử dụng các công cụ biên) mở ra những cơ hội lớn và tạo điều kiện cho các nhà đầu tư sẵn sàng mạo hiểm để thu lợi nhuận, tuy nhiên nó mang trong mình nguy cơ rủi ro khá cao. Chính vì vậy trước khi tiến hành giao dịch cần phải xem xét mọi mặt vấn đề chấp nhận tiến hành giao dịch cụ thể xét theo quan điểm của nguồn lực tài chính sẵn có và mức độ am hiểu thị trường tài chính.
Sử dụng thông tin: sử dụng toàn bộ hay riêng biệt các dữ liệu trên trang web của công ty TeleTrade như một nguồn cung cấp thông tin nhất định. Việc sử dụng tư liệu từ trang web cần kèm theo liên kết đến trang teletrade.vn. Việc tự động thu thập số liệu cũng như thông tin từ trang web TeleTrade đều không được phép.
Xin vui lòng liên hệ với pr@teletrade.global nếu có câu hỏi.
ngân hàng