- Phân tích
- Tin tức và các công cụ
- Tin tức thị trường
- Gold Price Forecast: XAU/USD displays a volatility squeeze below $1,840 ahead of FOMC minutes
Gold Price Forecast: XAU/USD displays a volatility squeeze below $1,840 ahead of FOMC minutes
- Gold price has scaled above $1,840.00 as the USD Index has sensed a minor correction.
- Investors will look for cues that will provide guidance on terminal rate and inflation projections from the FOMC minutes.
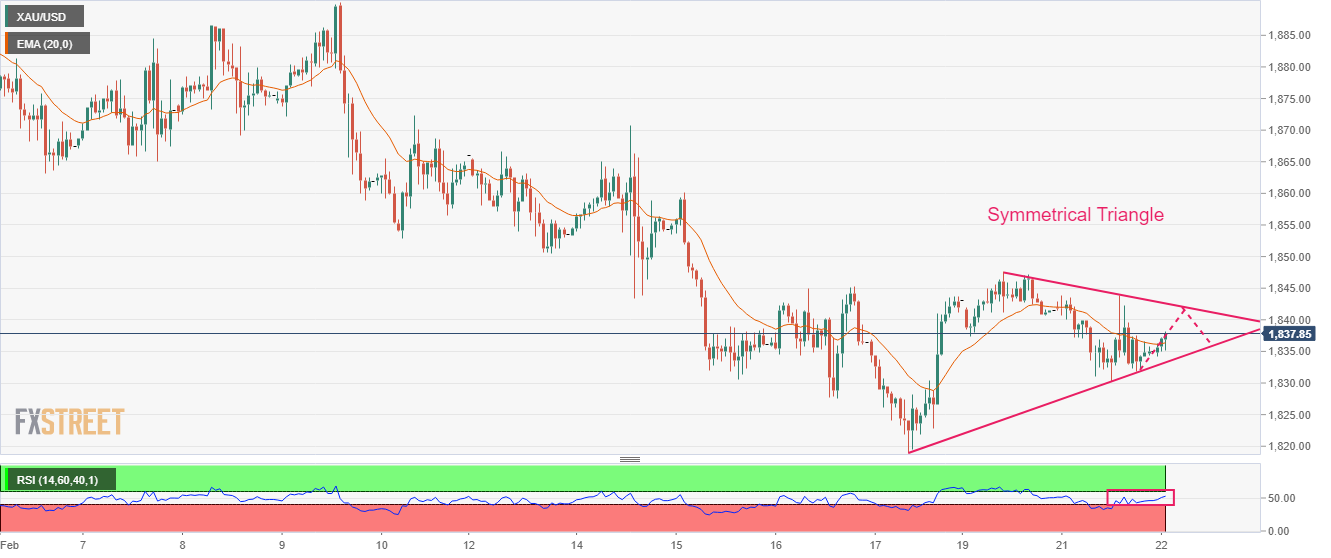
- Gold price is auctioning in a Symmetrical Triangle chart pattern that indicates a sheer volatility contraction.
Gold price (XAU/USD) has attempted a break above $1,838.00 despite the anxiety among the market participants ahead of the release of the Federal Open Market Committee (FOMC) minutes. The precious metal is broadly showing a volatility contraction as investors are refraining themselves from building aggressive positions ahead of the FOMC minutes release.
Some gains have been scored by the S&P500 futures after the index dived on Tuesday amid fears that the Federal Reserve’s (Fed) monetary policy is not restrictive enough to tame the stubborn inflation. However, the market participants still need to be precautionary as the overall market mood is quite risk-averse.
The US Dollar Index (DXY) is attempting to rebound after a mild correction to near 103.70. Meanwhile, the yields on US government bonds have corrected minutely. The 10-year US Treasury yields have dropped below 3.95%, however, the upside seems favored amid hawkish Fed bets.
Investors are shifting their focus completely towards the release of the FOMC minutes, which will provide a detailed explanation of the 25 bps interest rate hike in February’s monetary policy meeting. Apart from that, investors will look for cues that will provide guidance on terminal rate and inflation projections for the mid-term and for a longer horizon.
Gold technical analysis
Gold price is auctioning in a Symmetrical Triangle chart pattern that indicates a sheer volatility contraction on an hourly scale. The downward-sloping trendline of the above-mentioned chart pattern is placed from February 20 high at $1,847.59 while the upward-sloping trendline is placed from February 17 low at $1,818.93.
The 20-period Exponential Moving Average (EMA) at $1,836.33 is overlapping on the asset price, which indicates indecisiveness in the sentiment of the market participants.
Meanwhile, the Relative Strength Index (RSI) (14) is oscillating in the 40.00-60.00, which signals a lackluster performance ahead.
Gold hourly chart


© 2000-2026. Bản quyền Teletrade.
Trang web này được quản lý bởi Teletrade D.J. LLC 2351 LLC 2022 (Euro House, Richmond Hill Road, Kingstown, VC0100, St. Vincent and the Grenadines).
Thông tin trên trang web không phải là cơ sở để đưa ra quyết định đầu tư và chỉ được cung cấp cho mục đích làm quen.
Giao dịch trên thị trường tài chính (đặc biệt là giao dịch sử dụng các công cụ biên) mở ra những cơ hội lớn và tạo điều kiện cho các nhà đầu tư sẵn sàng mạo hiểm để thu lợi nhuận, tuy nhiên nó mang trong mình nguy cơ rủi ro khá cao. Chính vì vậy trước khi tiến hành giao dịch cần phải xem xét mọi mặt vấn đề chấp nhận tiến hành giao dịch cụ thể xét theo quan điểm của nguồn lực tài chính sẵn có và mức độ am hiểu thị trường tài chính.
Sử dụng thông tin: sử dụng toàn bộ hay riêng biệt các dữ liệu trên trang web của công ty TeleTrade như một nguồn cung cấp thông tin nhất định. Việc sử dụng tư liệu từ trang web cần kèm theo liên kết đến trang teletrade.vn. Việc tự động thu thập số liệu cũng như thông tin từ trang web TeleTrade đều không được phép.
Xin vui lòng liên hệ với pr@teletrade.global nếu có câu hỏi.
ngân hàng