- Phân tích
- Tin tức và các công cụ
- Tin tức thị trường
- Gold Price Forecast: XAU/USD looks set for further downside to near $1,820 on aggressive Fed bets
Gold Price Forecast: XAU/USD looks set for further downside to near $1,820 on aggressive Fed bets
- Gold price is eyeing more downside to near $1,820.00 amid hawkish FOMC minutes.
- FOMC minutes state China’s reopening and the Russia-Ukraine war still hold the risk of further escalation in inflation.
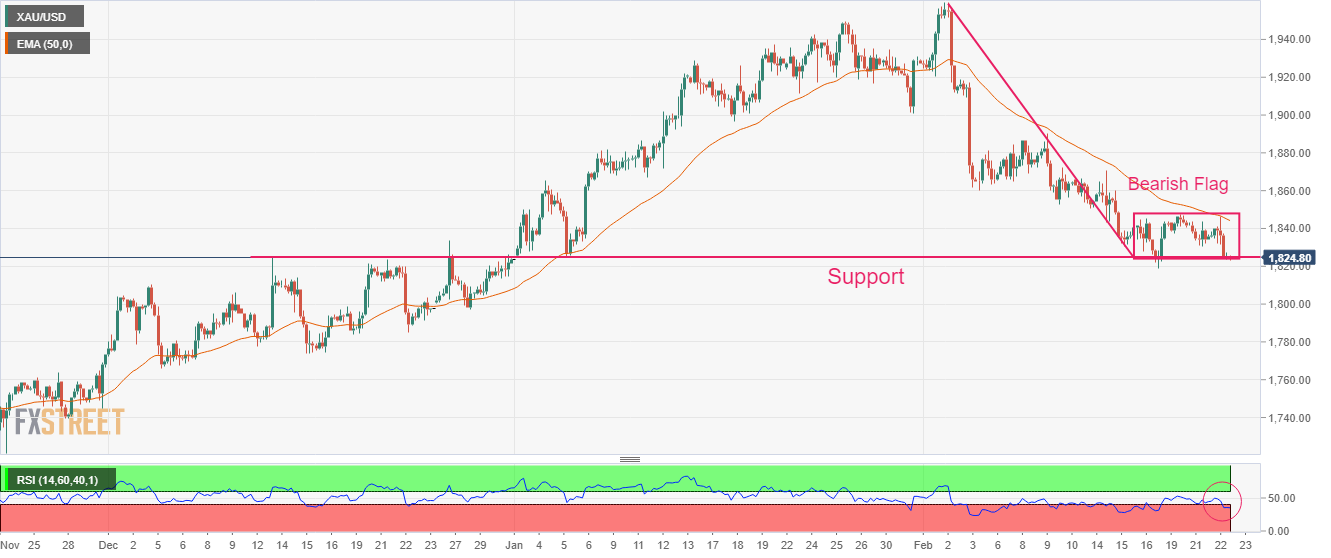
- Gold price is auctioning in an Inverted Flag, which is a bearish trend continuation pattern.
Gold price (XAU/USD) is displaying a sideways auction around $1,825.00 in the Asian session. The precious metal has turned sideways after a vertical sell-off and is expected to continue its downside to $1,820.00 as the Federal Open Market Committee (FOMC) minutes are conveying more rates to tame stubborn inflation.
The US Dollar Index (DXY) is aiming to recapture the weekly resistance of 104.33 as further policy restrictions to bring down inflation cannot be ruled out. S&P500 futures are demonstrating some gains in the Tokyo session after a choppy Wednesday, portraying a minor recovery in the risk appetite of the market participants. The return delivered on the 10-year US Treasury yields is marginally dropped to near 3.92%.
The minutes of the Federal Reserve (Fed)’s February monetary policy meeting explain inflation to be persistent as the reopening of China’s economy and the Russia-Ukraine war still hold the risk of further escalation in the price index. Meanwhile, St. Louis Fed President James Bullard has supported an aggressive monetary policy ahead. Fed policymaker sees the terminal rate at around 5.4%.
For further guidance, United States Gross Domestic Product (GDP) (Q4) data will remain in the spotlight. The annualized GDP data is seen unchanged at 2.9%. Economic activities in the US have remained contracting in the past few months. Therefore, the US GDP could deliver a downside surprise.
Gold technical analysis
Gold price is forming an Inverted Flag chart pattern, which is a bearish trend-following pattern. The pattern formation is near the horizontal support plotted from December 13 high at $1,824.55 on a four-hour scale. The chart pattern indicates a sheer consolidation that is followed by a breakdown. Usually, the consolidation phase of the chart pattern serves as an inventory adjustment in which those participants initiate shorts, which prefer to enter an auction after the establishment of a bearish bias.
The 50-period Exponential Moving Average (EMA) at $1,844.00 is acting as a major barricade for the Gold bulls.
Also, the Relative Strength Index (RSI) (14) has slipped into the bearish range of 20.00-40.00, which indicates more weakness ahead.
Gold four-hour chart


© 2000-2026. Bản quyền Teletrade.
Trang web này được quản lý bởi Teletrade D.J. LLC 2351 LLC 2022 (Euro House, Richmond Hill Road, Kingstown, VC0100, St. Vincent and the Grenadines).
Thông tin trên trang web không phải là cơ sở để đưa ra quyết định đầu tư và chỉ được cung cấp cho mục đích làm quen.
Giao dịch trên thị trường tài chính (đặc biệt là giao dịch sử dụng các công cụ biên) mở ra những cơ hội lớn và tạo điều kiện cho các nhà đầu tư sẵn sàng mạo hiểm để thu lợi nhuận, tuy nhiên nó mang trong mình nguy cơ rủi ro khá cao. Chính vì vậy trước khi tiến hành giao dịch cần phải xem xét mọi mặt vấn đề chấp nhận tiến hành giao dịch cụ thể xét theo quan điểm của nguồn lực tài chính sẵn có và mức độ am hiểu thị trường tài chính.
Sử dụng thông tin: sử dụng toàn bộ hay riêng biệt các dữ liệu trên trang web của công ty TeleTrade như một nguồn cung cấp thông tin nhất định. Việc sử dụng tư liệu từ trang web cần kèm theo liên kết đến trang teletrade.vn. Việc tự động thu thập số liệu cũng như thông tin từ trang web TeleTrade đều không được phép.
Xin vui lòng liên hệ với pr@teletrade.global nếu có câu hỏi.
ngân hàng