- Phân tích
- Tin tức và các công cụ
- Tin tức thị trường
- GBP/USD Price Analysis: Bears look to seize control, break below 200 DMA awaited
GBP/USD Price Analysis: Bears look to seize control, break below 200 DMA awaited
- GBP/USD meets with aggressive supply on Thursday and dives back closer to the weekly low.
- The setup favours bears and supports prospects for an eventual break below the 200 DMA.
- A sustained move beyond the 50-day SMA is needed to negate the near-term bearish outlook.
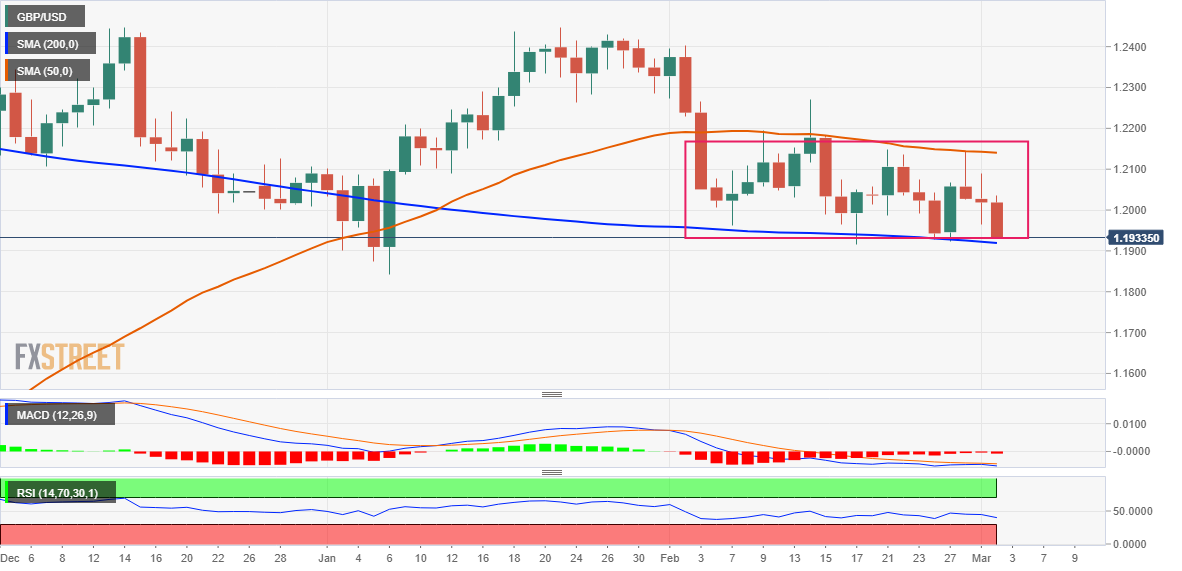
The GBP/USD pair comes under intense selling pressure on Thursday and extends its intraday downward trajectory heading into the North American session. The pair is currently placed below the mid-1.1900s, down over 0.60% for the day, and remains well within the striking distance of the weekly low touched on Monday.
Looking at the broader picture, the GBP/USD pair is trading just above a technically significant 200-day Simple Moving Average (SMA) support, currently pegged around the 1.1920-1.1915 region. The said area coincides with the lower end of a short-term trading range witnessed over the past two weeks or so, which constitutes the formation of a rectangle on the daily chart.
Given that oscillators on the daily have just started gaining negative traction, a convincing break below a technically significant SMA will be seen as a fresh trigger for bearish traders. The GBP/USD could then slide towards retesting the YTD low, around the 1.1840 area set in January, which if broken will complete a bearish double-top pattern formed near the 1.2445-1.2450 region.
On the flip side, attempted recovery moves might now confront stiff resistance near the 1.2000 psychological mark ahead of the daily swing high, around the 1.2035 region and the 1.2065-1.2070 supply zone. Any subsequent move-up could attract fresh sellers near the 1.2100 mark and remain capped near the 50-day SMA strong barrier, currently around the 1.2135-1.2140 area.
Some follow-through buying has the potential to lift the GBP/USD pair towards the 1.2200 round-figure mark en route to the February 14 swing high, around the 1.2265-1.2270 region. A sustained strength beyond the latter will suggest that the slide from the 1.2445-1.2450 supply zone has run its course and shift the near-term bias back in favour of bullish traders.
GBP/USD daily chart
Key levels to watch


© 2000-2026. Bản quyền Teletrade.
Trang web này được quản lý bởi Teletrade D.J. LLC 2351 LLC 2022 (Euro House, Richmond Hill Road, Kingstown, VC0100, St. Vincent and the Grenadines).
Thông tin trên trang web không phải là cơ sở để đưa ra quyết định đầu tư và chỉ được cung cấp cho mục đích làm quen.
Giao dịch trên thị trường tài chính (đặc biệt là giao dịch sử dụng các công cụ biên) mở ra những cơ hội lớn và tạo điều kiện cho các nhà đầu tư sẵn sàng mạo hiểm để thu lợi nhuận, tuy nhiên nó mang trong mình nguy cơ rủi ro khá cao. Chính vì vậy trước khi tiến hành giao dịch cần phải xem xét mọi mặt vấn đề chấp nhận tiến hành giao dịch cụ thể xét theo quan điểm của nguồn lực tài chính sẵn có và mức độ am hiểu thị trường tài chính.
Sử dụng thông tin: sử dụng toàn bộ hay riêng biệt các dữ liệu trên trang web của công ty TeleTrade như một nguồn cung cấp thông tin nhất định. Việc sử dụng tư liệu từ trang web cần kèm theo liên kết đến trang teletrade.vn. Việc tự động thu thập số liệu cũng như thông tin từ trang web TeleTrade đều không được phép.
Xin vui lòng liên hệ với pr@teletrade.global nếu có câu hỏi.
ngân hàng