- Phân tích
- Tin tức và các công cụ
- Tin tức thị trường
- AUD/USD Price Analysis: Absence of recovery signals favors more downside, 0.6500 eyed
AUD/USD Price Analysis: Absence of recovery signals favors more downside, 0.6500 eyed
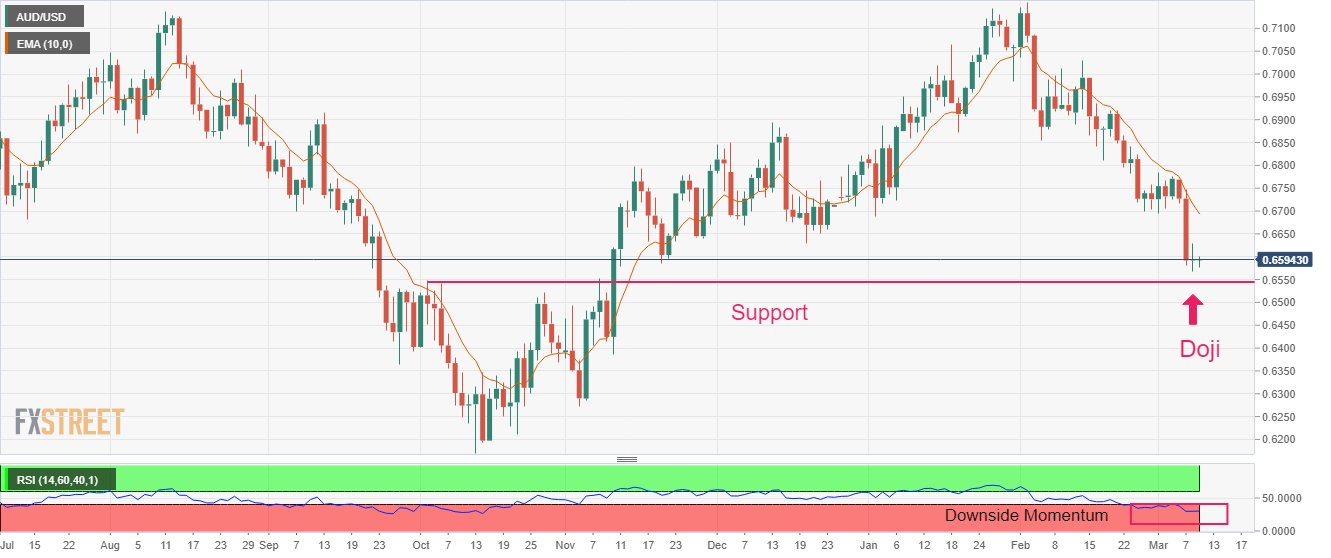
- AUD/USD is attempting to scale above 0.6600, however, the risk-off mood is still intact.
- A Doji candlestick formation indicates indecisiveness among market participants.
- An oscillation in the 20.00-40.00 range by the RSI (14) indicates that the bearish momentum is currently active.
The AUD/USD pair is displaying a subdued performance below 0.6600 in the Asian session. The upside in the Aussie asset seems restricted as Reserve Bank of Australia (RBA) Governor Philip Lowe has considered a pause in the rate-hiking spree and the Chinese economy is struggling to accelerate domestic demand despite significant reopening measures.
S&P500 futures have witnessed immense pressure as a sense of deflation conveyed by Chinese Consumer Price Index (CPI) and Producer Price Index (PPI) data indicates that the economy will take plenty of time to strengthen its economic outlook.
The US Dollar Index (DXY) is auctioning in a limited range above 105.20 as investors are awaiting the release of the United States Nonfarm Payrolls (NFP) data for fresh impetus.
AUD/USD has formed a Doji candlestick pattern, which indicates indecisiveness among the sentiment of market participants for further direction. Usually, a Doji formation indicates a reversal after an established trend. However, it requires more filters to confirm a reversal. Also, the negligence of Doji is considered as the continuation of the ongoing trend.
The Australian Dollar might continue to face selling pressure from the 10-period Exponential Moving Average (EMA) at around 0.6700.
An oscillation in the 20.00-40.00 range by the Relative Strength Index (RSI) (14) indicates that the bearish momentum is currently active. The momentum indicator is not shown any sign of divergence and a situation of oversold.
Going forward, a breakdown of Wednesday’s low at 0.6568 will drag the asst toward the horizontal support plotted from October 4 high at 0.6547 followed by the round-level support at 0.6500.
In an alternate scenario, a break above Doji’s high at 0.6629 will push the Aussie asset toward December 22 low at 0.6650. A break above the same might expose the major to February 27 low near 0.6700.
AUD/USD daily chart


© 2000-2026. Bản quyền Teletrade.
Trang web này được quản lý bởi Teletrade D.J. LLC 2351 LLC 2022 (Euro House, Richmond Hill Road, Kingstown, VC0100, St. Vincent and the Grenadines).
Thông tin trên trang web không phải là cơ sở để đưa ra quyết định đầu tư và chỉ được cung cấp cho mục đích làm quen.
Giao dịch trên thị trường tài chính (đặc biệt là giao dịch sử dụng các công cụ biên) mở ra những cơ hội lớn và tạo điều kiện cho các nhà đầu tư sẵn sàng mạo hiểm để thu lợi nhuận, tuy nhiên nó mang trong mình nguy cơ rủi ro khá cao. Chính vì vậy trước khi tiến hành giao dịch cần phải xem xét mọi mặt vấn đề chấp nhận tiến hành giao dịch cụ thể xét theo quan điểm của nguồn lực tài chính sẵn có và mức độ am hiểu thị trường tài chính.
Sử dụng thông tin: sử dụng toàn bộ hay riêng biệt các dữ liệu trên trang web của công ty TeleTrade như một nguồn cung cấp thông tin nhất định. Việc sử dụng tư liệu từ trang web cần kèm theo liên kết đến trang teletrade.vn. Việc tự động thu thập số liệu cũng như thông tin từ trang web TeleTrade đều không được phép.
Xin vui lòng liên hệ với pr@teletrade.global nếu có câu hỏi.
ngân hàng