- Phân tích
- Tin tức và các công cụ
- Tin tức thị trường
- USD/MXN Price Analysis: Retakes 19.00 mark, eyes 100-day SMA/38.2% Fibo. confluence hurdle
USD/MXN Price Analysis: Retakes 19.00 mark, eyes 100-day SMA/38.2% Fibo. confluence hurdle
- USD/MXN gains traction for the fourth straight day and trades near a one-month high set on Monday.
- Bulls now await a move beyond the 100-day SMA and 38.2% Fibo. confluence before placing fresh bets.
- Weakness back below the 18.35 horizontal support is needed to offset the near-term positive outlook.
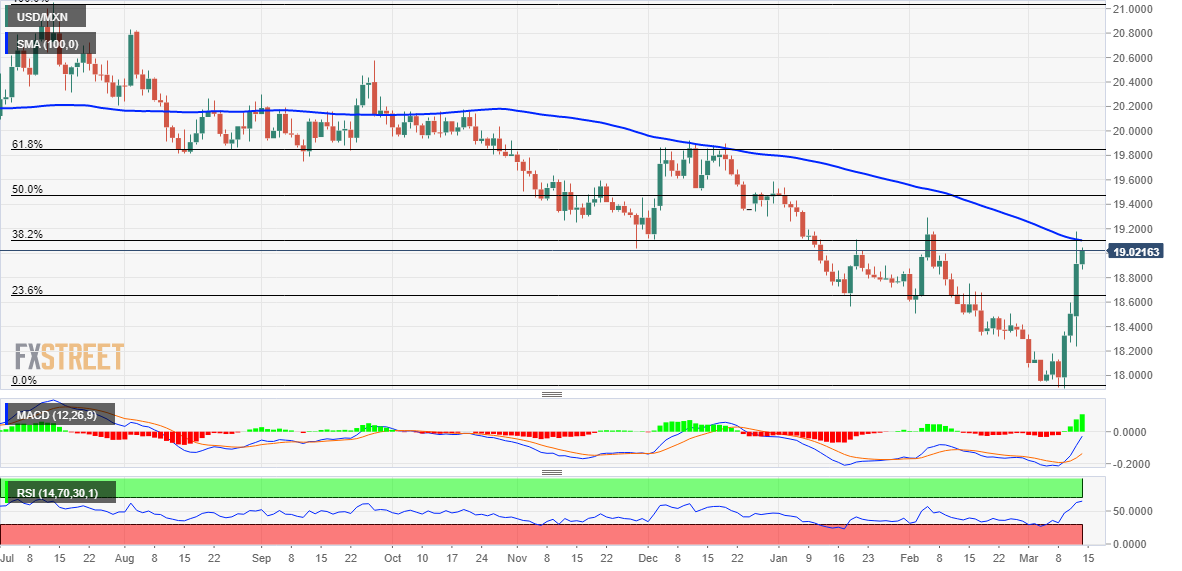
The USD/MXN pair attracts some buying for the fourth successive day on Tuesday and maintains its bid tone through the early part of the European session. The pair steadily climbs back above the 19.00 mark and remains well within the striking distance of over a one-month top touched on Monday.
Given that oscillators on the daily chart are holding in the positive territory and are still far from being in the overbought zone, the technical setup favours bullish traders. That said, the overnight failures to find acceptance above the 100-day Simple Moving Average (SMA) and the 38.2% Fibonacci retracement level of the July 2022-March 2023 downfall warrant caution. This makes it prudent to wait for a convincing break through the said confluence barrier before positioning for any further appreciating move.
The USD/MXN pair could then aim to surpass the February monthly swing high, around the 19.30 region and climb to the 50% Fibo. level, around the mid-19.00s. The upward trajectory could get extended towards testing the 19.75-19.80 horizontal support breakpoint, which now coincides with the 61.8% Fibo. level and should act as a pivotal point. A convincing breakthrough will set the stage for an extension of the recent strong recovery move from sub-18.00 levels, or a multi-year low touched last week.
On the flip side, the 23.6% Fibo. level, around the 18.65 area, now seems to protect the immediate downside ahead of the 18.35 horizontal support. Sustained weakness below will suggest that a one-week-old uptrend has run out of steam and make the USD/MXN pair vulnerable to retesting the 18.00-17.90 support zone.
USD/MXN daily chart
Key levels to watch


© 2000-2026. Bản quyền Teletrade.
Trang web này được quản lý bởi Teletrade D.J. LLC 2351 LLC 2022 (Euro House, Richmond Hill Road, Kingstown, VC0100, St. Vincent and the Grenadines).
Thông tin trên trang web không phải là cơ sở để đưa ra quyết định đầu tư và chỉ được cung cấp cho mục đích làm quen.
Giao dịch trên thị trường tài chính (đặc biệt là giao dịch sử dụng các công cụ biên) mở ra những cơ hội lớn và tạo điều kiện cho các nhà đầu tư sẵn sàng mạo hiểm để thu lợi nhuận, tuy nhiên nó mang trong mình nguy cơ rủi ro khá cao. Chính vì vậy trước khi tiến hành giao dịch cần phải xem xét mọi mặt vấn đề chấp nhận tiến hành giao dịch cụ thể xét theo quan điểm của nguồn lực tài chính sẵn có và mức độ am hiểu thị trường tài chính.
Sử dụng thông tin: sử dụng toàn bộ hay riêng biệt các dữ liệu trên trang web của công ty TeleTrade như một nguồn cung cấp thông tin nhất định. Việc sử dụng tư liệu từ trang web cần kèm theo liên kết đến trang teletrade.vn. Việc tự động thu thập số liệu cũng như thông tin từ trang web TeleTrade đều không được phép.
Xin vui lòng liên hệ với pr@teletrade.global nếu có câu hỏi.
ngân hàng