- Phân tích
- Tin tức và các công cụ
- Tin tức thị trường
- Gold Price Forecast: XAU/USD continues to juggle above $1,900 despite US Inflation softens
Gold Price Forecast: XAU/USD continues to juggle above $1,900 despite US Inflation softens
- Gold price is struggling to come out of the woods despite the continuation of declining US Inflation.
- The USD Index is defending the critical support of 103.50 but looks prone to the further downside amid the risk-on mood.
- Monthly US Retail Sales data is expected to contract by 0.3% vs. the former release of 3% expansion.
Gold price (XAU/USD) is inside the woods despite the United States inflation figures meeting expectations. The precious metal is continuously oscillating in a narrow range of $1,895-1,913 from Monday. The release of the US Consumer Price Index (CPI) failed to deliver a power-pack action in the Gold price, however, the upside bias looks solidified as bets for smaller rate hikes from the Federal Reserve (Fed) have soared.
The US Dollar Index (DXY) is defending the critical support of 103.50 but looks prone to the further downside as investors’ risk appetite has improved dramatically. S&P500 futures witnessed responsive buying from the market participants as higher odds of a smaller rate hike from Fed chair Jerome Powell might postpone a likely recession in the US economy, portraying a sheer recovery in overall optimism.
Contrary to the risk-on mood, the demand for US Treasury bonds remained vulnerable, which led the 10-year US Treasury yields higher above 3.68%.
The headline US CPI was expanded by 0.4% on a monthly basis, as expected and the annual figure softened to 6.0% from the former release of 6.4%. And, the core CPI that excludes oil and food prices dropped marginally to 5.5% from the former release of 5.6%. The continuation of a declining trend in the US inflation seems delightful for the Fed.
Going forward, investors will keep an eye on the US Retail Sales (Feb) data. Monthly Retail Sales data is expected to contract by 0.3% vs. the former release of 3% expansion. This indicates that resilience in consumer spending is over and the Fed is on track of achieving the 2% inflation target.
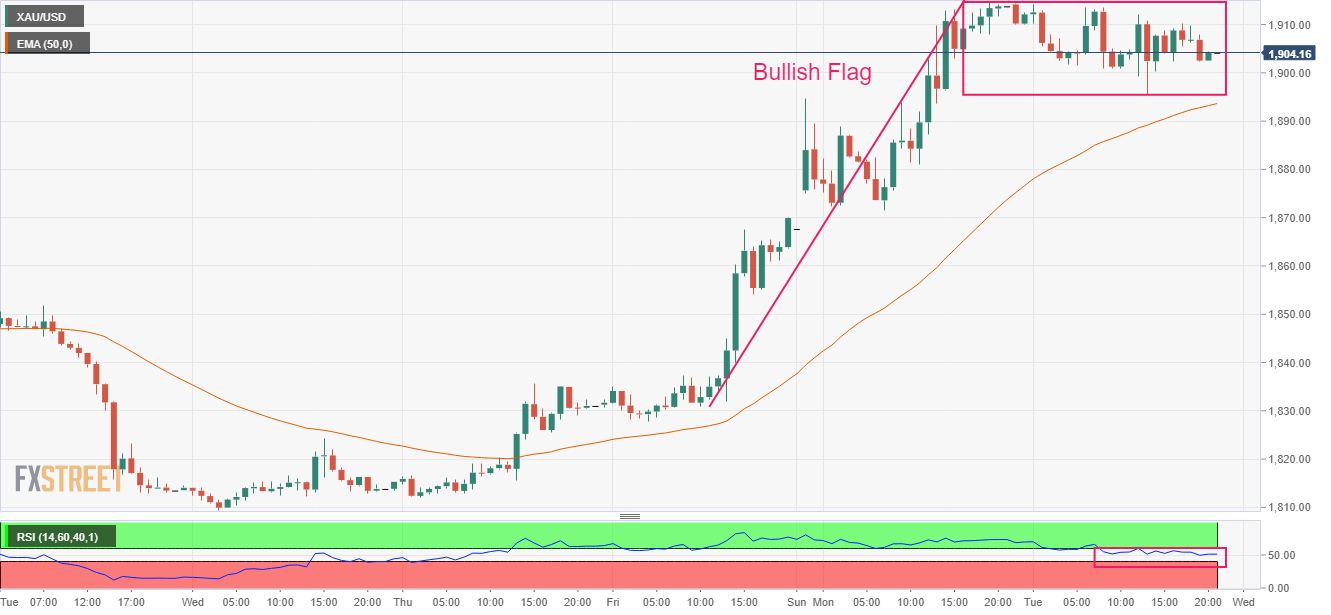
Gold technical analysis
Gold price is forming a Bullish Flag chart pattern on an hourly scale, which indicates a continuation of the bullish momentum after the breakout of a consolidation. Usually, the consolidation phase of the chart pattern serves as an inventory adjustment in which those participants initiate longs, which prefer to enter an auction after the establishment of a bullish bias.
Advancing 50-period Exponential Moving Average (EMA) at $1,894.00 add to the upside filters.
The Relative Strength Index (RSI) (14) is oscillating in a bullish range of 40.00-60.00. A break into the bullish range of 60.00-80.00 will trigger the upside momentum.
Gold hourly chart


© 2000-2026. Bản quyền Teletrade.
Trang web này được quản lý bởi Teletrade D.J. LLC 2351 LLC 2022 (Euro House, Richmond Hill Road, Kingstown, VC0100, St. Vincent and the Grenadines).
Thông tin trên trang web không phải là cơ sở để đưa ra quyết định đầu tư và chỉ được cung cấp cho mục đích làm quen.
Giao dịch trên thị trường tài chính (đặc biệt là giao dịch sử dụng các công cụ biên) mở ra những cơ hội lớn và tạo điều kiện cho các nhà đầu tư sẵn sàng mạo hiểm để thu lợi nhuận, tuy nhiên nó mang trong mình nguy cơ rủi ro khá cao. Chính vì vậy trước khi tiến hành giao dịch cần phải xem xét mọi mặt vấn đề chấp nhận tiến hành giao dịch cụ thể xét theo quan điểm của nguồn lực tài chính sẵn có và mức độ am hiểu thị trường tài chính.
Sử dụng thông tin: sử dụng toàn bộ hay riêng biệt các dữ liệu trên trang web của công ty TeleTrade như một nguồn cung cấp thông tin nhất định. Việc sử dụng tư liệu từ trang web cần kèm theo liên kết đến trang teletrade.vn. Việc tự động thu thập số liệu cũng như thông tin từ trang web TeleTrade đều không được phép.
Xin vui lòng liên hệ với pr@teletrade.global nếu có câu hỏi.
ngân hàng