- Phân tích
- Tin tức và các công cụ
- Tin tức thị trường
- Gold Price Forecast: XAU/USD displays volatility contraction around $1,920 Fed policy hogs limelight
Gold Price Forecast: XAU/USD displays volatility contraction around $1,920 Fed policy hogs limelight
- Gold price is showing volatility contraction as investors have mixed responses to Fed’s policy outlook.
- The street believes that the reason behind deepening fears of the banking crisis is the Fed’s steepest and fastest rate hikes.
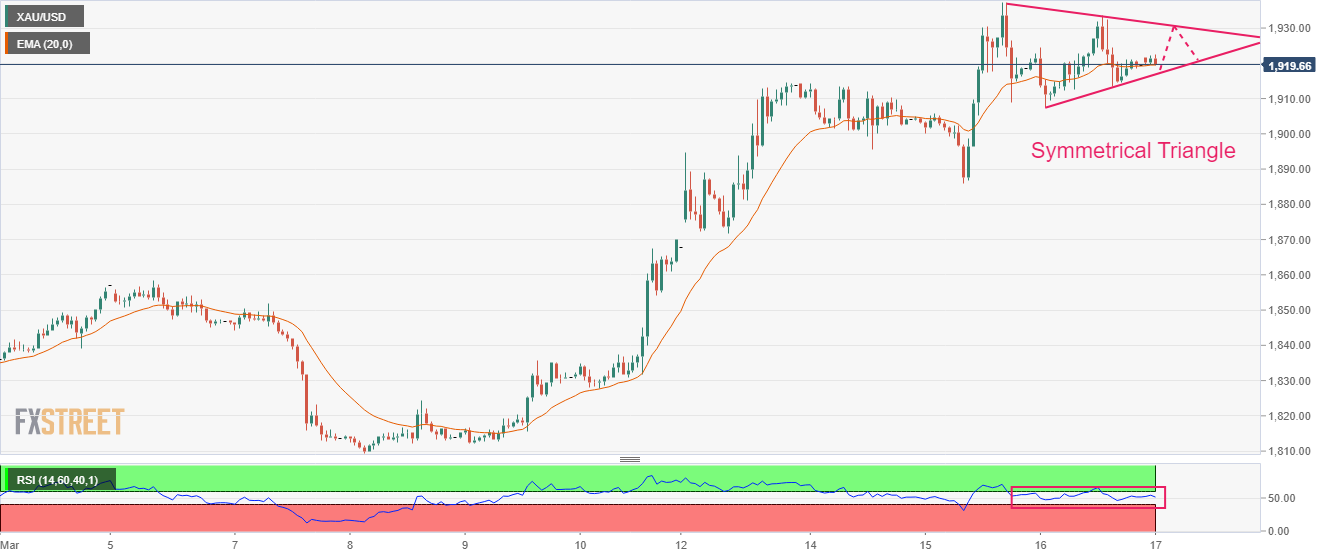
- Gold price is auctioning in a Symmetrical Triangle chart pattern, which indicates a squeeze in volatility.
Gold price (XAU/USD) is demonstrating a sheer squeeze in volatility amid the puzzle for monetary policy outlook by the Federal Reserve (Fed), which will be announced next week. The policy puzzle is getting more confusing as First Republic Bank has come under scrutiny after the collapse of Silicon Valley Bank (SVB) and Signature Bank.
Federal Reserve executes its monetary policy through commercial banks, which are going through a rough phase and investors are worried that more burden of higher rates would lead to more banks’ debacles.
The street believes that the reason behind deepening fears of a banking crisis is the steepest and fastest interest rate hikes from the Fed. Therefore, the odds of an unchanged monetary policy have stemmed. However, the CME Fedwatch tool is showing mere 20% chances that Fed chair Jerome Powell would keep interest rates steady.
S&P500 futures are showing nominal losses in the Asian session after a super-bullish Thursday, however, the risk appetite is still solid. The US Dollar Index (DXY) continues to juggle around 104.40 as investors are awaiting the preliminary Michigan Consumer Sentiment Index (March) data. A steady number is anticipated at 67.0. Meanwhile, the return generated on the 10-year US Treasury bonds looks sticky at around 3.58%.
Gold technical analysis
Gold price is auctioning in a Symmetrical Triangle chart pattern on an hourly scale, which indicates a squeeze in volatility that is followed by an expansion in the same. The downward-sloping trendline of the aforementioned chart pattern is placed from March 15 high around $1,939.40 while the upward-sloping trendline is placed from March 16 low at $1,907.56.
Overlapping 20-period Exponential Moving Average (EMA) at $1,919.60 with the asset indicates a rangebound move.
Adding to that, the Relative Strength Index (RSI) (14) is oscillating in the 40.00-60.00 range, which indicates that investors are awaiting a potential trigger for further action.
Gold hourly chart


© 2000-2026. Bản quyền Teletrade.
Trang web này được quản lý bởi Teletrade D.J. LLC 2351 LLC 2022 (Euro House, Richmond Hill Road, Kingstown, VC0100, St. Vincent and the Grenadines).
Thông tin trên trang web không phải là cơ sở để đưa ra quyết định đầu tư và chỉ được cung cấp cho mục đích làm quen.
Giao dịch trên thị trường tài chính (đặc biệt là giao dịch sử dụng các công cụ biên) mở ra những cơ hội lớn và tạo điều kiện cho các nhà đầu tư sẵn sàng mạo hiểm để thu lợi nhuận, tuy nhiên nó mang trong mình nguy cơ rủi ro khá cao. Chính vì vậy trước khi tiến hành giao dịch cần phải xem xét mọi mặt vấn đề chấp nhận tiến hành giao dịch cụ thể xét theo quan điểm của nguồn lực tài chính sẵn có và mức độ am hiểu thị trường tài chính.
Sử dụng thông tin: sử dụng toàn bộ hay riêng biệt các dữ liệu trên trang web của công ty TeleTrade như một nguồn cung cấp thông tin nhất định. Việc sử dụng tư liệu từ trang web cần kèm theo liên kết đến trang teletrade.vn. Việc tự động thu thập số liệu cũng như thông tin từ trang web TeleTrade đều không được phép.
Xin vui lòng liên hệ với pr@teletrade.global nếu có câu hỏi.
ngân hàng