- Phân tích
- Tin tức và các công cụ
- Tin tức thị trường
- NZD/USD Price Analysis: Formation of an Inverted H&S favors a solid upside
NZD/USD Price Analysis: Formation of an Inverted H&S favors a solid upside
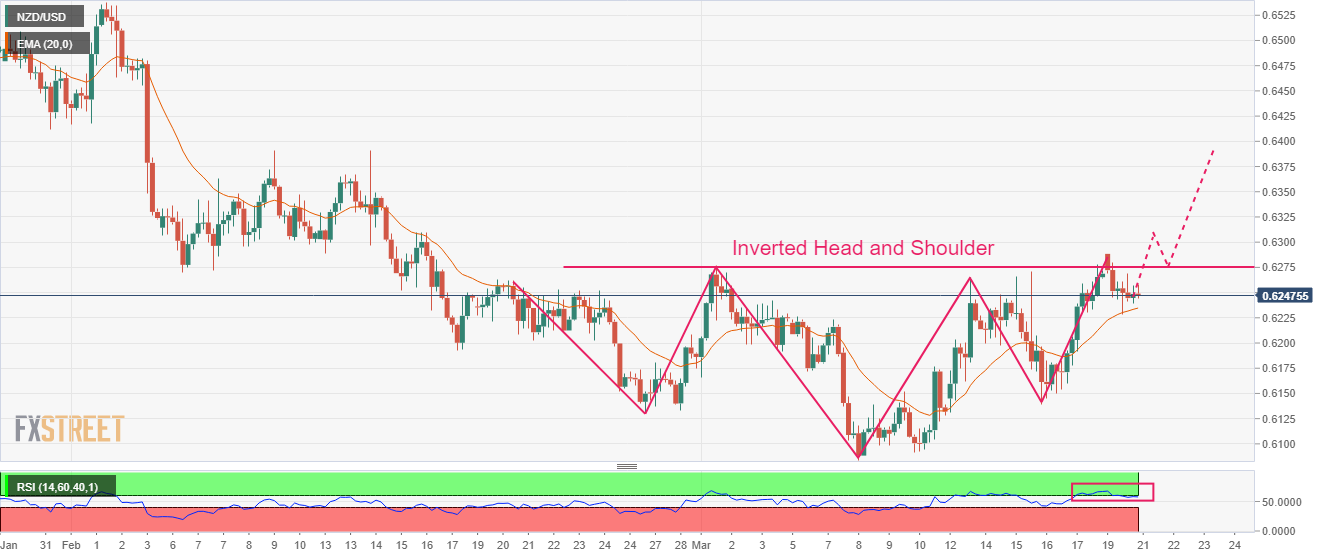
- NZD/USD has remained sideways after failing to recapture the immediate resistance of 0.6280.
- The formation of an Inverted H&S formation solidifies a bullish reversal ahead.
- The 20-period EMA at 0.6234 is providing a cushion to the New Zealand Dollar.
The NZD/USD pair is making efforts in defending the critical support of 0.6240 in the early Asian session. The Kiwi asset has remained sideways from Monday after failing to recapture the immediate resistance of 0.6280. Mixed responses to the interest rate policy of the Federal Reserve (Fed) have shifted the major to the sideline.
S&P500 futures have continued their upside momentum after a decent recovery on Monday, portraying appreciation in the risk-taking ability of the market participants. The US Dollar Index (DXY) continued its losing spell on Monday led by United States banking shakedown.
The New Zealand Dollar didn’t display any significant action on steady monetary policy by the People’s Bank of China (PBoC). The street was anticipating further rate cuts to spurt the overall demand in the Chinese economy. It is worth noting that New Zealand is one of the crucial trading partners of China and further expansion in PBoC’s monetary policy would have supported the New Zealand Dollar.
NZD/USD is forming an Inverted Head and Shoulder chart pattern on a four-hour scale. The chart pattern displays a prolonged consolidation and results in a bullish reversal after a breakout of the neckline, which is plotted from the March 01 high at 0.6276.
The 20-period Exponential Moving Average (EMA) at 0.6234 is providing a cushion to the New Zealand Dollar.
Meanwhile, the Relative Strength Index (RSI) (14) is making efforts in reclaiming the bullish range of 60.00-80.00. An occurrence of the same would solidify the Kiwi asset further.
A buying opportunity in the Kiwi asset will emerge it will surpass March 1 high at 0.6276, which will drive the pair toward the round-level resistance at 0.6300 followed by February 14 high at 0.6389.
In an alternate scenario, a breakdown of the January 6 low at 0.6193 will drag the asset toward November 28 low at 0.6155. A slippage below the latter will expose the asset for more downside toward the round-level support at 0.6100.
NZD/USD four-hour chart


© 2000-2026. Bản quyền Teletrade.
Trang web này được quản lý bởi Teletrade D.J. LLC 2351 LLC 2022 (Euro House, Richmond Hill Road, Kingstown, VC0100, St. Vincent and the Grenadines).
Thông tin trên trang web không phải là cơ sở để đưa ra quyết định đầu tư và chỉ được cung cấp cho mục đích làm quen.
Giao dịch trên thị trường tài chính (đặc biệt là giao dịch sử dụng các công cụ biên) mở ra những cơ hội lớn và tạo điều kiện cho các nhà đầu tư sẵn sàng mạo hiểm để thu lợi nhuận, tuy nhiên nó mang trong mình nguy cơ rủi ro khá cao. Chính vì vậy trước khi tiến hành giao dịch cần phải xem xét mọi mặt vấn đề chấp nhận tiến hành giao dịch cụ thể xét theo quan điểm của nguồn lực tài chính sẵn có và mức độ am hiểu thị trường tài chính.
Sử dụng thông tin: sử dụng toàn bộ hay riêng biệt các dữ liệu trên trang web của công ty TeleTrade như một nguồn cung cấp thông tin nhất định. Việc sử dụng tư liệu từ trang web cần kèm theo liên kết đến trang teletrade.vn. Việc tự động thu thập số liệu cũng như thông tin từ trang web TeleTrade đều không được phép.
Xin vui lòng liên hệ với pr@teletrade.global nếu có câu hỏi.
ngân hàng