- Phân tích
- Tin tức và các công cụ
- Tin tức thị trường
- Gold Price Forecast: XAU/USD prods key hurdle as yields and US Dollar stabilize
Gold Price Forecast: XAU/USD prods key hurdle as yields and US Dollar stabilize
- Gold price struggles to extend two-day rebound as ascending resistance line from August 2022 prods bulls.
- Fresh concerns about banking crisis, Federal Reserve moves allow United States Treasury bond yields, US Dollar to lick their wounds.
- US preliminary PMIs, Durable Goods Orders will be important for Gold traders to watch for fresh impulse.
Gold price (XAU/USD) struggles to extend the two-day rebound from the 10-DMA as it seesaws around $1,993-94 during early Friday, following the retreat from an upward-sloping resistance line from the last August. In doing so, the XAU/USD tracks the latest consolidation of the US Dollar and United States Treasury bond yields ahead of a busy calendar.
Gold price rise amid market’s consolidation
Gold price remains sidelined as bulls fade upside momentum amid a pause in the United States Treasury bond yields and the US Dollar amid mixed catalysts surrounding and US data and fears of Federal Reserve’s (Fed) rate hikes. That said, the US Dollar Index (DXY) stays defensive near 102.60 after bouncing off a seven-week low the previous day while the US 10-year and two-year Treasury bond yields seesaw around 3.41% and 3.82% respectively by the press time.
US Chicago Fed National Activity Index (CFNAI) dropped to -0.19 in February versus 0.0 expected and 0.23 prior. Further, Weekly Initial Jobless Claims declined to 191K for the week ended on March 18, versus 192K prior and 203K market forecasts. It should be noted that the US New Home Sales rose 1.1% in February from 1.8% prior, versus 1.6% analysts’ estimation, whereas Kansas Fed Manufacturing Index for March rose to 3.0 from -9.0 prior and 6.0 expected.
It should be noted that a collapse in the banking shares and chatters that the Fed’s emergency lending to the banks has ballooned the balance sheet, renewing fears of more Fed rate hikes, which in turn allowed the Gold price to pare recent gains. Also favoring the XAU/USD’s pause in further upside could be the mixed US data.
Reuters said, “Federal Reserve emergency lending to banks, which hit record levels the last week, remained high in the latest week, amid continued large-scale extensions of credit to the financial system, which now includes official foreign borrowing.” The news also mentioned that borrowing from the Fed caused the size of its overall balance sheet to move to $8.8 trillion from $8.7 trillion the prior week.
Furthermore, the US Treasury Secretary’s testimony in front of the House Appropriations Financial Services Subcommittee probed the market’s previous risk-on mood and allowed the Gold buyers to take a breather. US Treasury Secretary Yellen said, “China and Russia may want to develop an alternative to the US dollar,” while also showing preparedness for additional deposit actions `if warranted'. “Strong actions have been taken to ensure deposits are safe.”
Busy calendar to entertain XAU/USD traders
Although the Gold price recently paused its north-run, the commodity remains firmer for the fourth consecutive week as traders brace for the preliminary readings of the United States S&P Global PMIs for March and the Durable Goods Orders for February. That said, the first readings of activity numbers from Europe and the UK, as well as the Retail Sales from Canada and Britain will also decorate the calendar and can keep the XAU/USD traders busy. It’s worth mentioning that the global central bankers, ex-Fed, remain hawkish and hence firmer data can allow the Gold price to pare recent gains, amid fears of more rate hikes.
Also read: S&P Global PMIs Preview: EU and US figures to shed light on economic progress
Gold price technical analysis
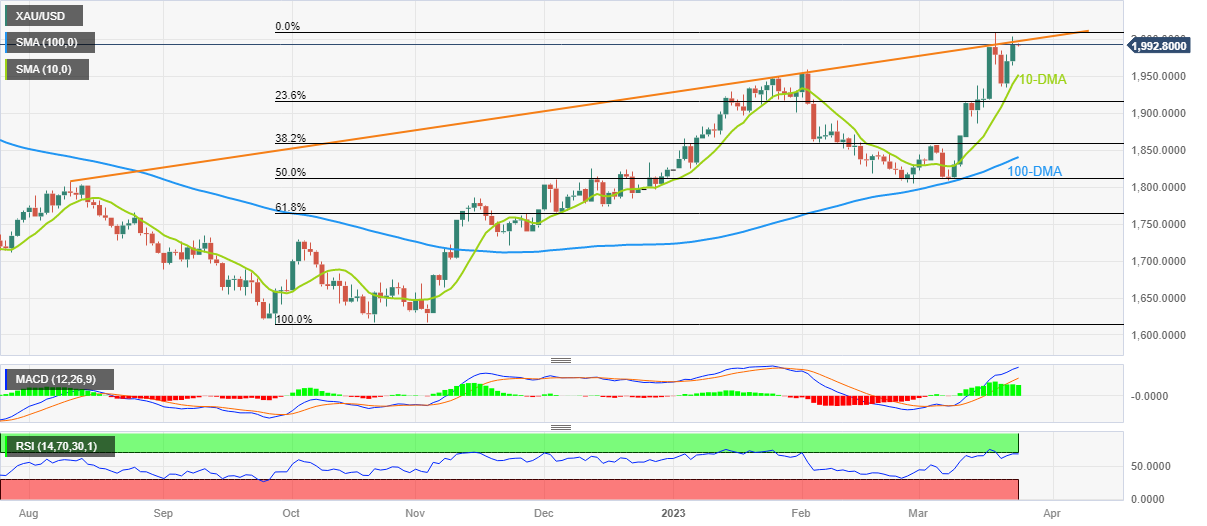
Gold’s pullback from a seven-month-old ascending resistance line couldn’t last long as the 10-Day Moving Average, around $1,938 by the press time, triggered the metal’s fresh run-up towards the aforementioned resistance line, close to the $2,000 round figure.
It’s worth noting that the Year-To-Date (YTD) high marked earlier in the week around $2,010 act as the last defense of the Gold bears before highlighting the previous yearly top surrounding $2,070.
On the contrary, February’s top surrounding $1,960 and the 10-DMA level of near $1,938 can restrict short-term XAU/USD downside ahead of directing the Gold sellers toward the $1,900 threshold.
Should the Gold price remains bearish past $1,900, the 38.2% Fibonacci retracement level of its upside from September 2022 to February 2023 advances, near $1,856, precedes the 100-DMA key support of $1,837 to limit the metal’s further upside.
On a different page, the Moving Average Convergence and Divergence (MACD) indicator prints bullish signals and supports the Gold buyers but the Relative Strength Index (RSI) line, placed at 14, nears the overbought territory and suggests limited room towards the north.
To sum up, the Gold price is likely to grind higher and can stay on the bull’s radar unless breaking the 100-DMA support.
Gold price: Daily chart
Trend: Further upside expected


© 2000-2026. Bản quyền Teletrade.
Trang web này được quản lý bởi Teletrade D.J. LLC 2351 LLC 2022 (Euro House, Richmond Hill Road, Kingstown, VC0100, St. Vincent and the Grenadines).
Thông tin trên trang web không phải là cơ sở để đưa ra quyết định đầu tư và chỉ được cung cấp cho mục đích làm quen.
Giao dịch trên thị trường tài chính (đặc biệt là giao dịch sử dụng các công cụ biên) mở ra những cơ hội lớn và tạo điều kiện cho các nhà đầu tư sẵn sàng mạo hiểm để thu lợi nhuận, tuy nhiên nó mang trong mình nguy cơ rủi ro khá cao. Chính vì vậy trước khi tiến hành giao dịch cần phải xem xét mọi mặt vấn đề chấp nhận tiến hành giao dịch cụ thể xét theo quan điểm của nguồn lực tài chính sẵn có và mức độ am hiểu thị trường tài chính.
Sử dụng thông tin: sử dụng toàn bộ hay riêng biệt các dữ liệu trên trang web của công ty TeleTrade như một nguồn cung cấp thông tin nhất định. Việc sử dụng tư liệu từ trang web cần kèm theo liên kết đến trang teletrade.vn. Việc tự động thu thập số liệu cũng như thông tin từ trang web TeleTrade đều không được phép.
Xin vui lòng liên hệ với pr@teletrade.global nếu có câu hỏi.
ngân hàng