- Phân tích
- Tin tức và các công cụ
- Tin tức thị trường
- NZD/USD surges as US inflation and jobs data softens
NZD/USD surges as US inflation and jobs data softens
- NZD/USD bulls hover at around 0.6290, eyeing a test of 0.6300 and beyond.
- US core PPI was unchanged at 3.4%, portraying stickier-than-expected inflation.
- The US labor market cools down on back-to-back weeks with unemployment claims rising above the consensus.
NZD/USD climbs to a new five-day high after forming a bullish engulfing candlestick pattern that exacerbated a jump of 80-plus pips on Thursday. The downtrend in inflation in the United States (US), alongside a cooling labor market, are the main reasons for today’s US Dollar (USD) weakness. The NZD/USD is trading at around 0.6290 after hitting a low of 0.6203.
NZD/USD underpinned by soft US economic data
US equities portray an upbeat sentiment. The case for a Fed pivot is gaining strength, as inflation on the producer side softened, and unemployment claims for the April 8 week exceeded estimates. The Producer Price Index (PPI) for March was -0.5% MoM, below forecasts of 0%, while the core PPI dropped 0.1% MoM, beneath estimates of a 0.3% expansion. Annually based, the PPI was 2.7%, below estimates, and the core PPI came at 3.4%, as foresaw by the consensus.
At the same time, the US Department of Labor (DoL) revealed that Initial Jobless Claims for the last week edged higher, at 239K above forecasts of 232K. Continuing claims fell to 1.81 million in the prior’s week to April 8.
The NZD/USD jumped from around 0.6240 toward its daily high of 0.6299, shy of cracking 0.6300 on a soft US Dollar. The greenback tested YTD lows, as shown by the US Dollar Index, at around 100.846, before reclaiming the 101.022 mark, losing 0.50%.
US Treasury bond yields continued their downward trajectory, namely the 2-year, losses two basis points at 3.945%, as traders estimate one more rate hike of the US Federal Reserve (Fed) before pausing. The CME Fed WatchTool shows odds for a 25 bps hike by the Fed are at 66.5%, below April 12 70.4% chances.
NZD/USD Technical Analysis
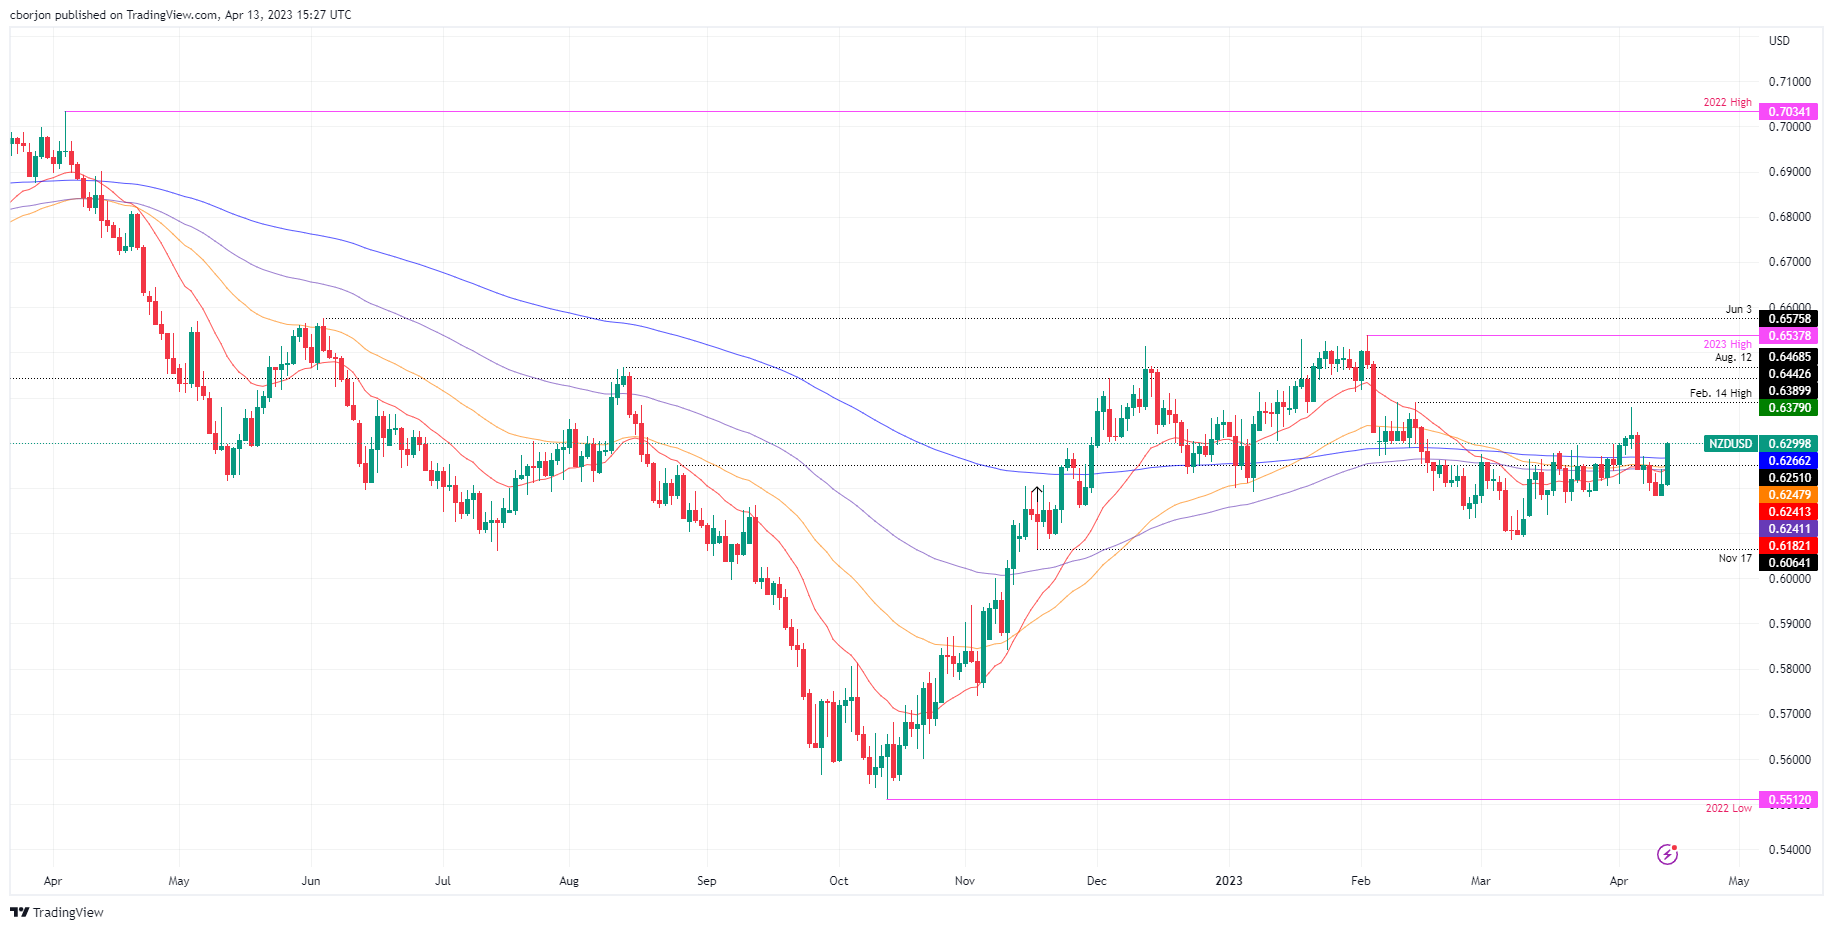
After breaking above the 200-day Exponential Moving Average (EMA) at 0.6266, the NZD/USD is poised to crack 0.6300. Once cleared, the NZD/USD pair could rally towards April 6 high at 0.6324, followed by the prior’s day cycle high at 0.6379. A breach of the latter will expose 0.6400. Conversely, with a daily close below 0.6300, buyers would be at risk of losing support at the 200-day EMA. Break below 0.6266, and the pair might dip towards the confluence of the 100 and 50-day EMAs at around 0.6240-48.


© 2000-2026. Bản quyền Teletrade.
Trang web này được quản lý bởi Teletrade D.J. LLC 2351 LLC 2022 (Euro House, Richmond Hill Road, Kingstown, VC0100, St. Vincent and the Grenadines).
Thông tin trên trang web không phải là cơ sở để đưa ra quyết định đầu tư và chỉ được cung cấp cho mục đích làm quen.
Giao dịch trên thị trường tài chính (đặc biệt là giao dịch sử dụng các công cụ biên) mở ra những cơ hội lớn và tạo điều kiện cho các nhà đầu tư sẵn sàng mạo hiểm để thu lợi nhuận, tuy nhiên nó mang trong mình nguy cơ rủi ro khá cao. Chính vì vậy trước khi tiến hành giao dịch cần phải xem xét mọi mặt vấn đề chấp nhận tiến hành giao dịch cụ thể xét theo quan điểm của nguồn lực tài chính sẵn có và mức độ am hiểu thị trường tài chính.
Sử dụng thông tin: sử dụng toàn bộ hay riêng biệt các dữ liệu trên trang web của công ty TeleTrade như một nguồn cung cấp thông tin nhất định. Việc sử dụng tư liệu từ trang web cần kèm theo liên kết đến trang teletrade.vn. Việc tự động thu thập số liệu cũng như thông tin từ trang web TeleTrade đều không được phép.
Xin vui lòng liên hệ với pr@teletrade.global nếu có câu hỏi.
ngân hàng