- Phân tích
- Tin tức và các công cụ
- Tin tức thị trường
- Gold Price Forecast: XAU/USD rebound needs validation from $2,010 and US GDP – Confluence Detector
Gold Price Forecast: XAU/USD rebound needs validation from $2,010 and US GDP – Confluence Detector
- Gold price retreats from intraday high, fades week-start rebound.
- Sour sentiment puts a floor under US Dollar amid debt ceiling drama, pre-Fed consolidation.
- Softer US Q1 GDP, Core PCE Price Index can confirm Fed policy pivot talks and propel XAU/USD bulls.
- Fewer hurdles stand to challenge Gold Price upside past $2,010, XAU/USD sellers should wait for $1,987 break.
Gold price (XAU/USD) consolidates the last two-week losses as market sentiment dwindles amid a light calendar, allowing traders to better prepare for the key US Q1 GDP and Core PCE Price Index, the Fed’s favorite inflation gauge.
It’s worth noting, however, that the quote’s corrective bounce needs validation from the $2,000 psychological magnet and the aforementioned key US data as traders struggle with the US debt ceiling concerns and the pre-Fed preparations. Apart from the sour sentiment and pre-data/event consolidation, the Gold Price remains firmer amid the US Dollar’s failure to cheer the sour sentiment, despite stopping the further downside of the greenback.
Moving on, Gold price remains directed toward the north amid broad US Dollar weakness but the quote’s further upside needs validation from the downbeat US Q1 GDP and the Fed’s favorite inflation gauge.
Also read: Gold Price Forecast: XAU/USD needs to find acceptance above 21 DMA for further upside
Gold Price: Key levels to watch
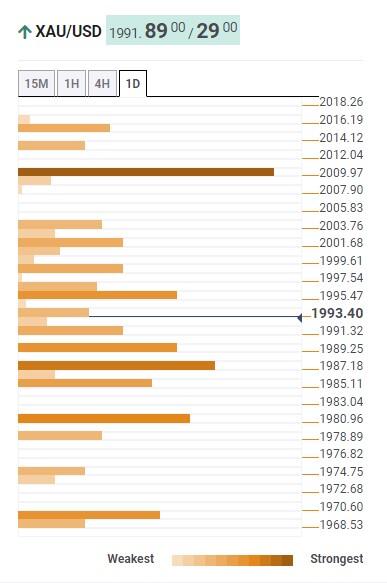
As per out Technical Confluence indicator Gold price retreats from a convergence of the Bollinger on the one-day and Pivot Point one-day R1, around the $2,000 psychological magnet.
Following that, the $2,010 level becomes a tough nut to crack for the Gold price as it comprises the Pivot Point one week R1 and the previous monthly high.
In a case where the Gold price remains firmer past $2,010, the odds of witnessing a run-up towards the monthly high surrounding $2,050 can’t be ruled out.
Alternatively, Fibonacci 38.2% on one week and 23.6% on one day together highlight $1,987 as the immediate key support of around $1,987.
Should the Gold price remains weak past $1,987, the Fibonacci 61.8% on one day and 23.6% on one week will highlight the $1,980 as the last defense of the XAU/USD bulls.
Here is how it looks on the tool
About Technical Confluences Detector
The TCD (Technical Confluences Detector) is a tool to locate and point out those price levels where there is a congestion of indicators, moving averages, Fibonacci levels, Pivot Points, etc. If you are a short-term trader, you will find entry points for counter-trend strategies and hunt a few points at a time. If you are a medium-to-long-term trader, this tool will allow you to know in advance the price levels where a medium-to-long-term trend may stop and rest, where to unwind positions, or where to increase your position size.


© 2000-2026. Bản quyền Teletrade.
Trang web này được quản lý bởi Teletrade D.J. LLC 2351 LLC 2022 (Euro House, Richmond Hill Road, Kingstown, VC0100, St. Vincent and the Grenadines).
Thông tin trên trang web không phải là cơ sở để đưa ra quyết định đầu tư và chỉ được cung cấp cho mục đích làm quen.
Giao dịch trên thị trường tài chính (đặc biệt là giao dịch sử dụng các công cụ biên) mở ra những cơ hội lớn và tạo điều kiện cho các nhà đầu tư sẵn sàng mạo hiểm để thu lợi nhuận, tuy nhiên nó mang trong mình nguy cơ rủi ro khá cao. Chính vì vậy trước khi tiến hành giao dịch cần phải xem xét mọi mặt vấn đề chấp nhận tiến hành giao dịch cụ thể xét theo quan điểm của nguồn lực tài chính sẵn có và mức độ am hiểu thị trường tài chính.
Sử dụng thông tin: sử dụng toàn bộ hay riêng biệt các dữ liệu trên trang web của công ty TeleTrade như một nguồn cung cấp thông tin nhất định. Việc sử dụng tư liệu từ trang web cần kèm theo liên kết đến trang teletrade.vn. Việc tự động thu thập số liệu cũng như thông tin từ trang web TeleTrade đều không được phép.
Xin vui lòng liên hệ với pr@teletrade.global nếu có câu hỏi.
ngân hàng