- Phân tích
- Tin tức và các công cụ
- Tin tức thị trường
- GBP/USD Price Analysis: Testing breakout of a rising channel pattern below 1.2550
GBP/USD Price Analysis: Testing breakout of a rising channel pattern below 1.2550
- GBP/USD is showing signs of exhaustion in the upside momentum after failing to extend the upside above 1.2583.
- The risk profile is favoring risk-sensitive assets amid solid quarterly performance from US tech-savvy stocks.
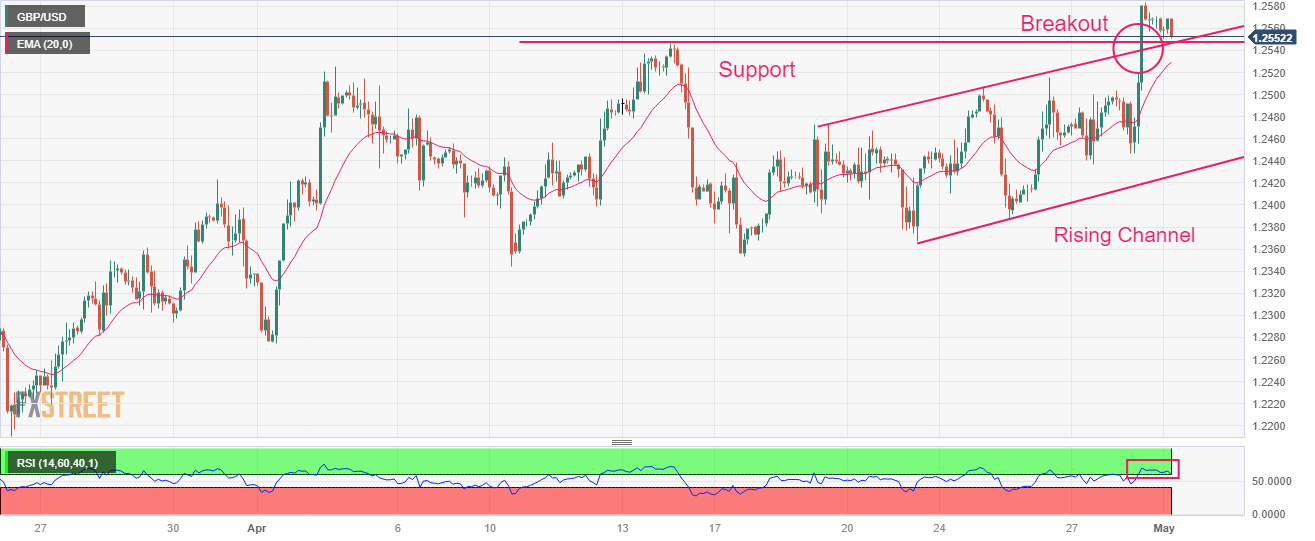
- GBP/USD has delivered a breakout of the Rising Channel chart pattern and is testing it with a minor correction to near 1.2546.
The GBP/USD pair is showing signs of exhaustion in the upside momentum after failing to extend the upside above 1.2583. The Cable has turned sideways around 1.2560 as investors are preparing for monetary policy by the Federal Reserve (Fed), which is scheduled for Wednesday.
The risk profile is favoring risk-sensitive assets as S&P500 futures are having minimal gains after a bullish Friday. Investors were gung-ho for United States equities after a solid quarterly performance from tech-savvy stocks.
The US Dollar Index (DXY) is eyeing a further stretch in recovery above 101.80 as the Fed is expected to raise interest rates further to tame sticky core inflation. US Consumer spending is resilient amid higher outlays for services.
GBP/USD has delivered a breakout of the Rising Channel chart pattern on a two-hour scale. An upside break of the Rising Channel chart pattern indicates sheer strength in the Pound Sterling. The immediate support is plotted from April 14 high at 1.2546.
Advancing 20-period Exponential Moving Average (EMA) at 1.2530 indicates more upside ahead.
Also, the Relative Strength Index (RSI) (14) has shifted into the bullish range of 60.00-80.00, hinting that the upside momentum is active for now.
A successful test of breakout near April 14 high at 1.2546 will drive the asset towards a fresh 10-month high at 1.2597, which is 08 June 2022 high. A breach of the latter will expose the asset to May 27 high at 1.2667.
On the flip side, a slippage below April 10 low at 1.2345 will expose the asset to March 30 low at 1.2294 followed by March 27 low at 1.2219.
GBP/USD two-hour chart


© 2000-2026. Bản quyền Teletrade.
Trang web này được quản lý bởi Teletrade D.J. LLC 2351 LLC 2022 (Euro House, Richmond Hill Road, Kingstown, VC0100, St. Vincent and the Grenadines).
Thông tin trên trang web không phải là cơ sở để đưa ra quyết định đầu tư và chỉ được cung cấp cho mục đích làm quen.
Giao dịch trên thị trường tài chính (đặc biệt là giao dịch sử dụng các công cụ biên) mở ra những cơ hội lớn và tạo điều kiện cho các nhà đầu tư sẵn sàng mạo hiểm để thu lợi nhuận, tuy nhiên nó mang trong mình nguy cơ rủi ro khá cao. Chính vì vậy trước khi tiến hành giao dịch cần phải xem xét mọi mặt vấn đề chấp nhận tiến hành giao dịch cụ thể xét theo quan điểm của nguồn lực tài chính sẵn có và mức độ am hiểu thị trường tài chính.
Sử dụng thông tin: sử dụng toàn bộ hay riêng biệt các dữ liệu trên trang web của công ty TeleTrade như một nguồn cung cấp thông tin nhất định. Việc sử dụng tư liệu từ trang web cần kèm theo liên kết đến trang teletrade.vn. Việc tự động thu thập số liệu cũng như thông tin từ trang web TeleTrade đều không được phép.
Xin vui lòng liên hệ với pr@teletrade.global nếu có câu hỏi.
ngân hàng