- Phân tích
- Tin tức và các công cụ
- Tin tức thị trường
- Gold Price Forecast: XAU/USD rebound appears elusive, $1,990 and $1,998 eyed – Confluence Detector
Gold Price Forecast: XAU/USD rebound appears elusive, $1,990 and $1,998 eyed – Confluence Detector
- Gold price clings to mild gains as traders turn cautious on full markets’ return, ahead of key data/events.
- Sluggish US Dollar, optimism surrounding China, India adds strength to the recovery moves.
- Hawkish Fed bets, US debt ceiling woes prod XAU/USD buyers ahead of Fed, US NFP.
- Multiple key resistances stand tall to challenge the Gold price upside, bears have a smoother road to drive.
Gold price (XAU/USD) portrays the market’s cautious optimism while posting mild gains near $1,985 as traders await the key central bank events amid full markets’ return on Tuesday.
That said, US Dollar’s retreat due to the looming default fears adds strength to the XAU/USD’s rebound. On the same line could be the sigh of relief from the First Republic Bank fallout fears after the US regulators seized assets and sold them to JP Morgan. Additionally, the International Monetary Fund’s (IMF) upbeat economic report surrounding the Asia-Pacific region, one of the biggest consumers of Gold, also allows the XAU/USD price to remain firmer.
However, hawkish Fed bets, the US-China tension and anxiety ahead of the top-tier US data/events, as well as central bank events at other major economies, also prod the Gold price upside.
Also read: Gold Price Forecast: XAU/USD extends the range play heading into key central bank event risks
Gold Price: Key levels to watch
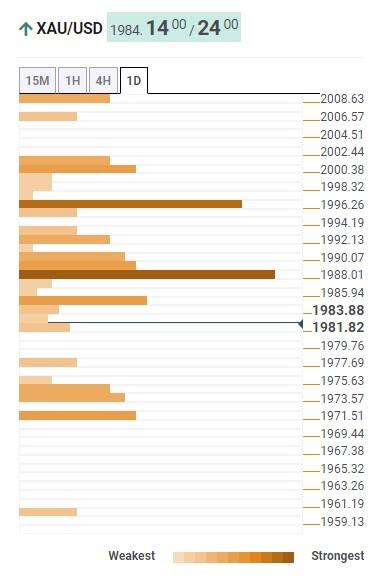
As per our Technical Confluence indicator, the Gold price remains depressed below the $1,990 resistance confluence comprising Fibonacci 61.8% on one-week and one-month, as well as Fibonacci 38.2% on one-day.
In addition to the $1,990 hurdle, the Fibonacci 38.2% on one-week, around $1,998, also acts as a short-term key upside resistance for the Gold buyers to track before retaking control.
Even so, a convergence of the Pivot Point one-day R1, middle band of the Bollinger on daily chart and Fibonacci 23.6% on one-week, near $2,001, can act as the final defense of the Gold sellers.
Meanwhile, the metal’s road towards the south appears smoother with minor support near $1,973, encompassing Pivot Point one-week S1, followed by the $1,970 mark comprising Pivot Point one-day S1 and lower band of the Bollinger on one-day.
Should the Gold bears keep the reins past $1,970, the odds of witnessing a slump toward the previous monthly low of around $1,950 can’t be ruled out.
Here is how it looks on the tool
About Technical Confluences Detector
The TCD (Technical Confluences Detector) is a tool to locate and point out those price levels where there is a congestion of indicators, moving averages, Fibonacci levels, Pivot Points, etc. If you are a short-term trader, you will find entry points for counter-trend strategies and hunt a few points at a time. If you are a medium-to-long-term trader, this tool will allow you to know in advance the price levels where a medium-to-long-term trend may stop and rest, where to unwind positions, or where to increase your position size.


© 2000-2026. Bản quyền Teletrade.
Trang web này được quản lý bởi Teletrade D.J. LLC 2351 LLC 2022 (Euro House, Richmond Hill Road, Kingstown, VC0100, St. Vincent and the Grenadines).
Thông tin trên trang web không phải là cơ sở để đưa ra quyết định đầu tư và chỉ được cung cấp cho mục đích làm quen.
Giao dịch trên thị trường tài chính (đặc biệt là giao dịch sử dụng các công cụ biên) mở ra những cơ hội lớn và tạo điều kiện cho các nhà đầu tư sẵn sàng mạo hiểm để thu lợi nhuận, tuy nhiên nó mang trong mình nguy cơ rủi ro khá cao. Chính vì vậy trước khi tiến hành giao dịch cần phải xem xét mọi mặt vấn đề chấp nhận tiến hành giao dịch cụ thể xét theo quan điểm của nguồn lực tài chính sẵn có và mức độ am hiểu thị trường tài chính.
Sử dụng thông tin: sử dụng toàn bộ hay riêng biệt các dữ liệu trên trang web của công ty TeleTrade như một nguồn cung cấp thông tin nhất định. Việc sử dụng tư liệu từ trang web cần kèm theo liên kết đến trang teletrade.vn. Việc tự động thu thập số liệu cũng như thông tin từ trang web TeleTrade đều không được phép.
Xin vui lòng liên hệ với pr@teletrade.global nếu có câu hỏi.
ngân hàng