- Phân tích
- Tin tức và các công cụ
- Tin tức thị trường
- Gold Price Forecast: XAU/USD keeps eyes on $2,073 hurdle and US NFP – Confluence Detector
Gold Price Forecast: XAU/USD keeps eyes on $2,073 hurdle and US NFP – Confluence Detector
- Gold price eases from record top, mildly offered of late, but stays beyond $2,042 support.
- Fed signals for policy pivot propel XAU/USD price, banking woes prod Gold buyers.
- Gold buyers need further acceptance from US NFP to keep the reins.
Gold price (XAU/USD) eases after refreshing the highest level on record as bulls take a breather ahead of the key US Nonfarm Payrolls (NFP).
Federal Reserve (Fed) hints to pause the rate hike trajectory after lifting the benchmark interest rates to the highest levels since 2007. The same joins Fed Chairman Jerome Powell’s cautious remarks, by suggesting the current monetary policy is at sufficiently restrictive levels, to weigh on the US Dollar and propel the Gold price.
Following that, Thursday’s mixed US data and increasing market bets on the Fed’s September 2023 rate hike add strength to the Gold price run-up. Additionally, fears of banking fallouts in the US and debt ceiling expiration also challenge the XAU/USD traders.
Alternatively, China’s softer PMIs and likely challenges for the US jobs report to meet downbeat forecasts, considering the strong early signals, tease the Gold sellers.
Moving on, the monthly prints of the US jobs report for April will be important to watch for clear directions.
Also read: Gold Price Forecast: XAU/USD en route to challenge record highs
Gold Price: Key levels to watch
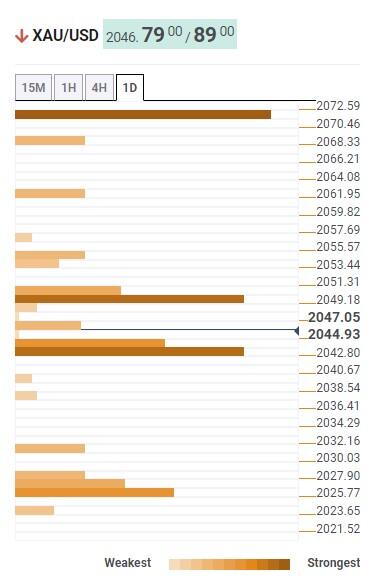
As per our Technical Confluence Indicator, Gold price floats above the $2,042 resistance-turned-support comprising the upper band of the Bollinger on one-day, Pivot Point one-month R1 and Pivot Point one-week R3.
Given the latest pullback in the Gold price, a clear downside break of $2,042 can quickly drag the Gold price to the $2,027 support confluence including the Fibonacci 23.6% on one-month and Pivot Point one-week R2.
It’s worth noting that a downside break of $2,027 can recall the $2,000 round figure on the XAU/USD chart.
On the contrary, the previous monthly high and Fibonacci 61.8% in one-day together offer an important upside hurdle for the Gold buyers to cross near $2,053.
Following that, a quick XAU/USD rally towards the $2,073 hurdle encompassing the previous yearly high and the upper bank of the Bollinger on four-hour play will be the key hurdle to watch for the Bulls before cheering the $2,100.
Here is how it looks on the tool
About Technical Confluences Detector
The TCD (Technical Confluences Detector) is a tool to locate and point out those price levels where there is a congestion of indicators, moving averages, Fibonacci levels, Pivot Points, etc. If you are a short-term trader, you will find entry points for counter-trend strategies and hunt a few points at a time. If you are a medium-to-long-term trader, this tool will allow you to know in advance the price levels where a medium-to-long-term trend may stop and rest, where to unwind positions, or where to increase your position size.


© 2000-2026. Bản quyền Teletrade.
Trang web này được quản lý bởi Teletrade D.J. LLC 2351 LLC 2022 (Euro House, Richmond Hill Road, Kingstown, VC0100, St. Vincent and the Grenadines).
Thông tin trên trang web không phải là cơ sở để đưa ra quyết định đầu tư và chỉ được cung cấp cho mục đích làm quen.
Giao dịch trên thị trường tài chính (đặc biệt là giao dịch sử dụng các công cụ biên) mở ra những cơ hội lớn và tạo điều kiện cho các nhà đầu tư sẵn sàng mạo hiểm để thu lợi nhuận, tuy nhiên nó mang trong mình nguy cơ rủi ro khá cao. Chính vì vậy trước khi tiến hành giao dịch cần phải xem xét mọi mặt vấn đề chấp nhận tiến hành giao dịch cụ thể xét theo quan điểm của nguồn lực tài chính sẵn có và mức độ am hiểu thị trường tài chính.
Sử dụng thông tin: sử dụng toàn bộ hay riêng biệt các dữ liệu trên trang web của công ty TeleTrade như một nguồn cung cấp thông tin nhất định. Việc sử dụng tư liệu từ trang web cần kèm theo liên kết đến trang teletrade.vn. Việc tự động thu thập số liệu cũng như thông tin từ trang web TeleTrade đều không được phép.
Xin vui lòng liên hệ với pr@teletrade.global nếu có câu hỏi.
ngân hàng