- Phân tích
- Tin tức và các công cụ
- Tin tức thị trường
- USD/MXN plunges to six-year lows as US CPI cools, speculations for a Fed pause
USD/MXN plunges to six-year lows as US CPI cools, speculations for a Fed pause
- USD/MXN nosedives to levels last seen in September 2017, printing a YTD low of 17.6017.
- US inflation data triggers speculations of a pause in the Fed’s tightening cycle.
- The Mexican economy is also showing disinflation, opening the door for Banxico to maintain interest rates.
USD/MXN dives to new six-year lows last seen in September 2017, after US inflation slowed down, as shown by data revealed, triggering speculations that the US Federal Reserve (Fed) can pause its tightening cycle. At the time of writing, the USD/MXN is trading at 17.6279, down 0.81%.
US Dollar weakens against Mexican Peso amid slowing inflation and expectations of unchanged interest rates
The USD/MXN fell below its previous year-to-date (YTD) low of 17.7392 on May 8, as the news hit the screens. The US Bureau of Labor Statistics (BLS) revealed April’s data with the Consumer Price Index (CPI) rising 0.4% MoM, and 4.9% YoY, the monthly figure aligned with estimates, while annually based, edged a tick lower. Excluding volatile items, the so-called core CPI rose by 0.4% MoM as expected, while annually based, it stood at 5.5%, unchanged.
US equities are climbing as investors have begun to price in a less aggressive Fed. The CME FedWatcth Tool shows odds of almost 87% chance that Powell and Co. will hold rates unchanged at the 5.00%-5.25% range.
Therefore, US Treasury bond yields are falling sharply, with 2s down eight bps at 3.941%, while the 10-year benchmark note rate sits at 3.458%, six bps lower than the open.
On the Mexican front, data revealed on Tuesday showed that the economy is also in a disinflation process, as INEGI reported that April’s CPI rose to 6.25% from 6.85% YoY. Headline inflation shrank 0.02% MoM, while core CPI advanced 0.39% MoM, and YoY remained at 7.67%.
That opens the door for the Bank of Mexico (Banxico) to keep rates unchanged after increasing 25 bps to the TIIE, which stands at 11.25%. A poll by the local branch of Citi in Mexico, the Citibanamex poll, showed that most analysts estimate Banxico’s to keep rates unchanged.
In the meantime, discussion around the debt ceiling in the US commenced on Tuesday. According to US Senate Majority Leader Schummer, he said that Staff-level talks on the ceiling are starting today, as of May 10.
USD/MXN Price Analysis: Technical outlook
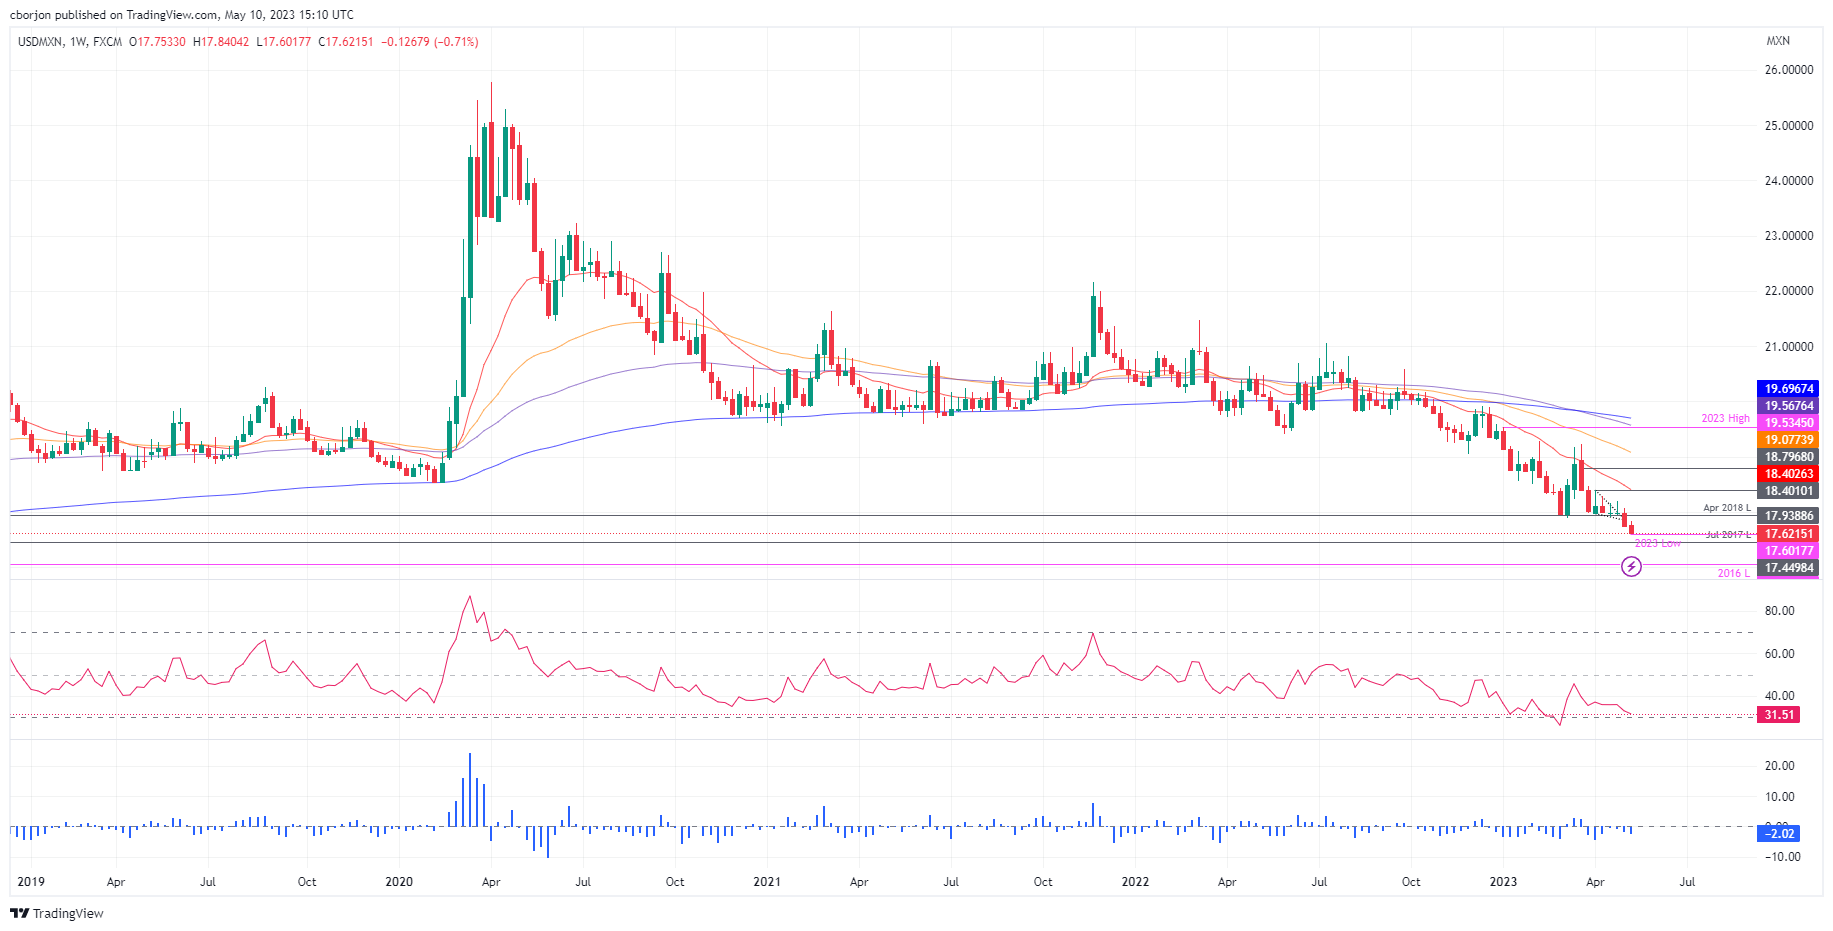
From a weekly chart perspective, the USD/MXN is headed for a continuation to lower levels, as shown by the chart. The next support would be the psychological 17.50 figure, followed by the July 2017 low of 17.4498. On the other hand, USD/MXN buyers would need to reclaim the April 2018 swing low, which turned resistance at 17.9388, ahead of the psychological 18.00 figure. A decisive break would expose the 20-week EMA at 18.4021.
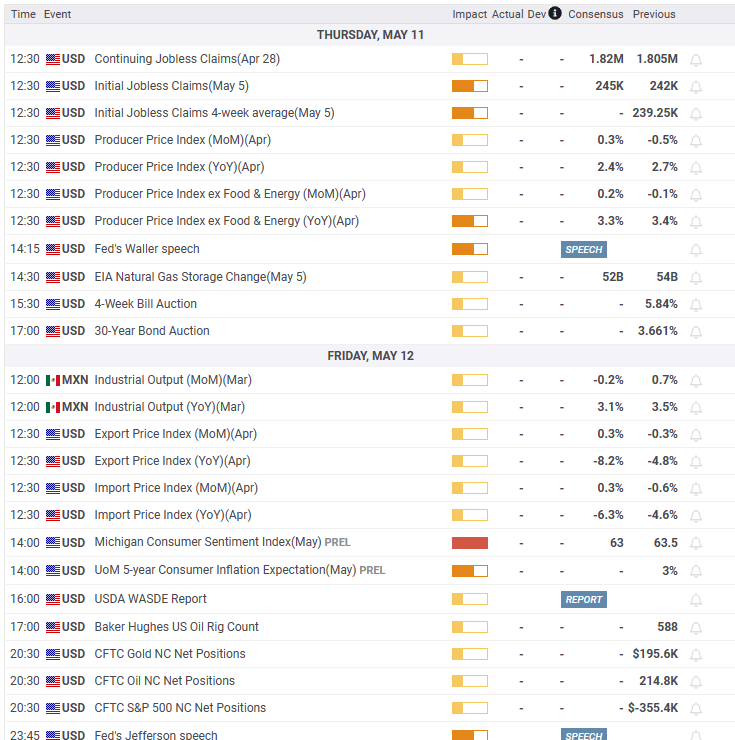
Upcoming events


© 2000-2026. Bản quyền Teletrade.
Trang web này được quản lý bởi Teletrade D.J. LLC 2351 LLC 2022 (Euro House, Richmond Hill Road, Kingstown, VC0100, St. Vincent and the Grenadines).
Thông tin trên trang web không phải là cơ sở để đưa ra quyết định đầu tư và chỉ được cung cấp cho mục đích làm quen.
Giao dịch trên thị trường tài chính (đặc biệt là giao dịch sử dụng các công cụ biên) mở ra những cơ hội lớn và tạo điều kiện cho các nhà đầu tư sẵn sàng mạo hiểm để thu lợi nhuận, tuy nhiên nó mang trong mình nguy cơ rủi ro khá cao. Chính vì vậy trước khi tiến hành giao dịch cần phải xem xét mọi mặt vấn đề chấp nhận tiến hành giao dịch cụ thể xét theo quan điểm của nguồn lực tài chính sẵn có và mức độ am hiểu thị trường tài chính.
Sử dụng thông tin: sử dụng toàn bộ hay riêng biệt các dữ liệu trên trang web của công ty TeleTrade như một nguồn cung cấp thông tin nhất định. Việc sử dụng tư liệu từ trang web cần kèm theo liên kết đến trang teletrade.vn. Việc tự động thu thập số liệu cũng như thông tin từ trang web TeleTrade đều không được phép.
Xin vui lòng liên hệ với pr@teletrade.global nếu có câu hỏi.
ngân hàng