- Phân tích
- Tin tức và các công cụ
- Tin tức thị trường
- Gold Price Forecast: XAU/USD bulls eye $2,050 and more US inflation clues – Confluence Detector
Gold Price Forecast: XAU/USD bulls eye $2,050 and more US inflation clues – Confluence Detector
- Gold price struggles to defend weekly gains as $2,050 hurdle keeps pushing back XAU/USD buyers.
- Mixed details of US inflation, cautious optimism and softer China data prod Gold price upside.
- US PPI, consumer inflation expectations eyed for clear directions.
Gold price (XAU/USD) stays on the way to posting a three-week uptrend despite the previous day’s retreat from the key $2,050 resistance. In doing so, the precious metal buyers benefit from the softer US inflation numbers and the downbeat US Dollar. However, mixed details of the US price pressure data join the US-China headlines and looming fears of the US default to prod the XAU/USD bulls.
It should be noted that the mixed concerns about the US inflation details and the market’s consolidation ahead of the US Producer Price Index (PPI), as well as the University of Michigan’s (UoM) 5-year Consumer Inflation Expectations, prod the Gold price upside. Furthermore, China’s lack of interest in placating the Sino-American tension and softer Consumer Price Index (CPI) from the dragon nation also seems to exert downside pressure on the Gold price.
Also read: Gold Price Forecast: XAU/USD defines a range but upside remains favored
Gold Price: Key levels to watch
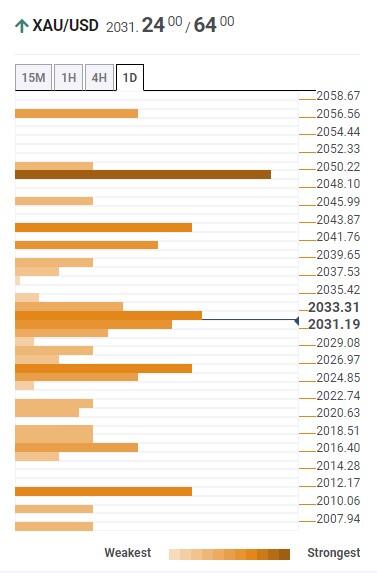
Our Technical Confluence Indicator portrays the Gold price struggle below the $2,050 key resistance comprising the upper band of the Bollinger on the daily chart and the highs marked on previous day, as well as in the previous month.
Ahead of the key $2,050 hurdle, the Pivot Point one-month R1 highlights the $2,043 as an intermediate challenge for the XAU/USD bulls to cross to validate the upside momentum.
Adding to the upside filters is the $2,057-58 region comprising the Fibonacci 23.6% on weekly basis.
It’s worth noting, however, that if the Gold price remains firmer past $2,058, the recently reported all-time high of around $2,080 will be in the spotlight.
Meanwhile, the middle band of the Bollinger on the four-hour play joins Fibonacci 23.6% on one-month to highlight $2,025 as an immediate support for the Gold price.
Following that, a slump towards the $2,015 level comprising the Fibonacci 61.8% on one-week can’t be ruled out.
In a case where the Gold price remains weak past $2,015, the $2,010 level may act as an additional downside filter before allowing the XAU/USD bears to occupy the driver’s seat. That said, Fibonacci 38.2% on one-month constitutes the stated support levels.
Here is how it looks on the tool
About Technical Confluences Detector
The TCD (Technical Confluences Detector) is a tool to locate and point out those price levels where there is a congestion of indicators, moving averages, Fibonacci levels, Pivot Points, etc. If you are a short-term trader, you will find entry points for counter-trend strategies and hunt a few points at a time. If you are a medium-to-long-term trader, this tool will allow you to know in advance the price levels where a medium-to-long-term trend may stop and rest, where to unwind positions, or where to increase your position size.


© 2000-2026. Bản quyền Teletrade.
Trang web này được quản lý bởi Teletrade D.J. LLC 2351 LLC 2022 (Euro House, Richmond Hill Road, Kingstown, VC0100, St. Vincent and the Grenadines).
Thông tin trên trang web không phải là cơ sở để đưa ra quyết định đầu tư và chỉ được cung cấp cho mục đích làm quen.
Giao dịch trên thị trường tài chính (đặc biệt là giao dịch sử dụng các công cụ biên) mở ra những cơ hội lớn và tạo điều kiện cho các nhà đầu tư sẵn sàng mạo hiểm để thu lợi nhuận, tuy nhiên nó mang trong mình nguy cơ rủi ro khá cao. Chính vì vậy trước khi tiến hành giao dịch cần phải xem xét mọi mặt vấn đề chấp nhận tiến hành giao dịch cụ thể xét theo quan điểm của nguồn lực tài chính sẵn có và mức độ am hiểu thị trường tài chính.
Sử dụng thông tin: sử dụng toàn bộ hay riêng biệt các dữ liệu trên trang web của công ty TeleTrade như một nguồn cung cấp thông tin nhất định. Việc sử dụng tư liệu từ trang web cần kèm theo liên kết đến trang teletrade.vn. Việc tự động thu thập số liệu cũng như thông tin từ trang web TeleTrade đều không được phép.
Xin vui lòng liên hệ với pr@teletrade.global nếu có câu hỏi.
ngân hàng