- Phân tích
- Tin tức và các công cụ
- Tin tức thị trường
- Gold Price Forecast: XAU/USD declines towards $2,000 as USD Index rebounds, US Retail Sales eyed
Gold Price Forecast: XAU/USD declines towards $2,000 as USD Index rebounds, US Retail Sales eyed
- Gold price is expected to return back to $2,000.00 as the USD Index is holding its support.
- S&P500 futures have recovered their entire losses and have turned positive, portraying solid appeal for US equities.
- Tuesday’s Retail sales data is seen expanding by 0.7% vs. a contraction of 0.6%.
Gold price (XAU/USD) has retreated from $2,019.00 after a less-confident recovery move in the Asian session. The precious metal is expected to return to the psychological support of $2,000.00 as the US Dollar Index (DXY) has rebounded firmly.
It seems that the marginal correction in the USD Index has been bought by investors and the asset is aiming to recapture a five-week high at 102.75.
S&P500 futures have recovered their entire losses and have turned positive, portraying solid appeal for US equities. Investors are pouring funds into equities in hopes that the Federal Reserve (Fed) will pause its aggressive policy-tightening spree to avoid further damage to economic prosperity.
Investors will get more clarity on Fed’s action after the release of the monthly US Retail Sales data (April). Tuesday’s Retail sales data is seen expanding by 0.7% vs. a contraction of 0.6%. A recovery in retail demand would escalate fears of further interest rate hikes from the Fed.
The USD Index is holding strength amid uncertainty over the outcome of US debt ceiling negotiations. US President Joe Biden has announced further negotiations with Republican leaders for raising the US debt ceiling limit to avoid default on obligated payments.
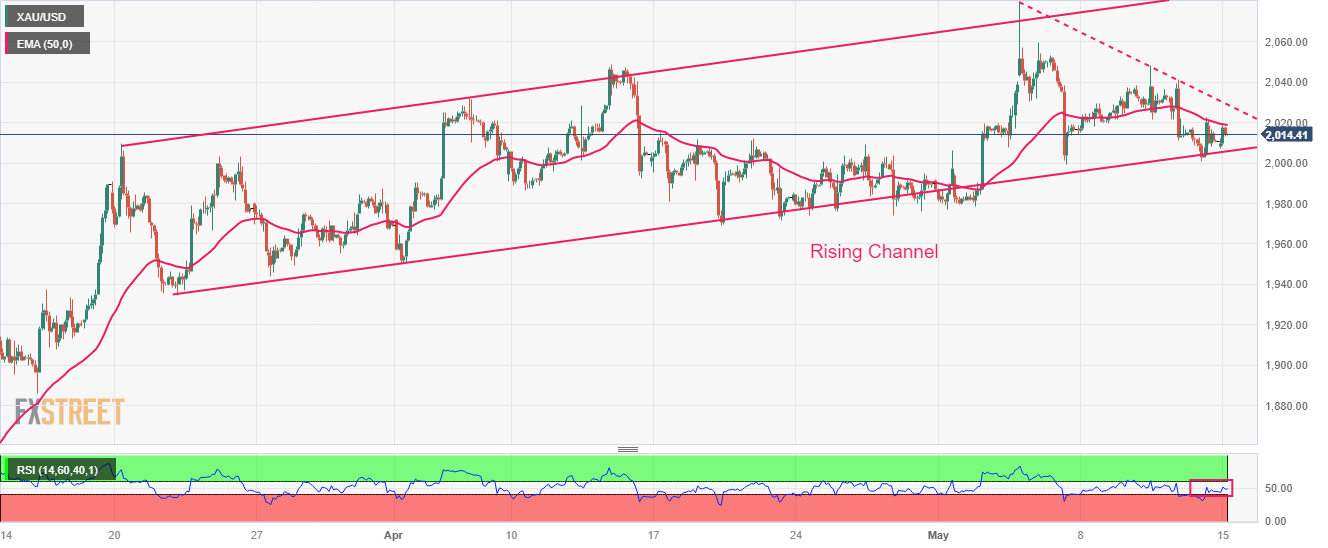
Gold technical analysis
Gold price is auctioning in a Rising Channel chart pattern on a two-hour scale. The upper portion of the aforementioned chart pattern is plotted from March 20 high at $2,009.88 while the lower portion is placed from March 22 low at $1,934.34. The downward-sloping trendline plotted from all-time highs at May 03 high at $2,079.78 is acting as a barricade for the Gold bulls.
Also, the 50-period Exponential Moving Average (EMA) at $2,019.38 has restricted the upside of the Gold bulls.
The Relative Strength Index (RSI) (14) is oscillating in the 40.00-60.00, indicating a lackluster move ahead.
Gold two-hour chart


© 2000-2026. Bản quyền Teletrade.
Trang web này được quản lý bởi Teletrade D.J. LLC 2351 LLC 2022 (Euro House, Richmond Hill Road, Kingstown, VC0100, St. Vincent and the Grenadines).
Thông tin trên trang web không phải là cơ sở để đưa ra quyết định đầu tư và chỉ được cung cấp cho mục đích làm quen.
Giao dịch trên thị trường tài chính (đặc biệt là giao dịch sử dụng các công cụ biên) mở ra những cơ hội lớn và tạo điều kiện cho các nhà đầu tư sẵn sàng mạo hiểm để thu lợi nhuận, tuy nhiên nó mang trong mình nguy cơ rủi ro khá cao. Chính vì vậy trước khi tiến hành giao dịch cần phải xem xét mọi mặt vấn đề chấp nhận tiến hành giao dịch cụ thể xét theo quan điểm của nguồn lực tài chính sẵn có và mức độ am hiểu thị trường tài chính.
Sử dụng thông tin: sử dụng toàn bộ hay riêng biệt các dữ liệu trên trang web của công ty TeleTrade như một nguồn cung cấp thông tin nhất định. Việc sử dụng tư liệu từ trang web cần kèm theo liên kết đến trang teletrade.vn. Việc tự động thu thập số liệu cũng như thông tin từ trang web TeleTrade đều không được phép.
Xin vui lòng liên hệ với pr@teletrade.global nếu có câu hỏi.
ngân hàng