- Phân tích
- Tin tức và các công cụ
- Tin tức thị trường
- USD/CAD Price Analysis: Shifts auction below 1.3500 as oil rebounds and USD Index retreats
USD/CAD Price Analysis: Shifts auction below 1.3500 as oil rebounds and USD Index retreats
- USD/CAD has slipped sharply below 1.3500 amid a sharp recovery in the oil price upside exhaustion in the USD Index.
- Monthly Canadian Retail Sales data is seen contracting by 1.4% vs. a contraction of 0.2% recorded earlier.
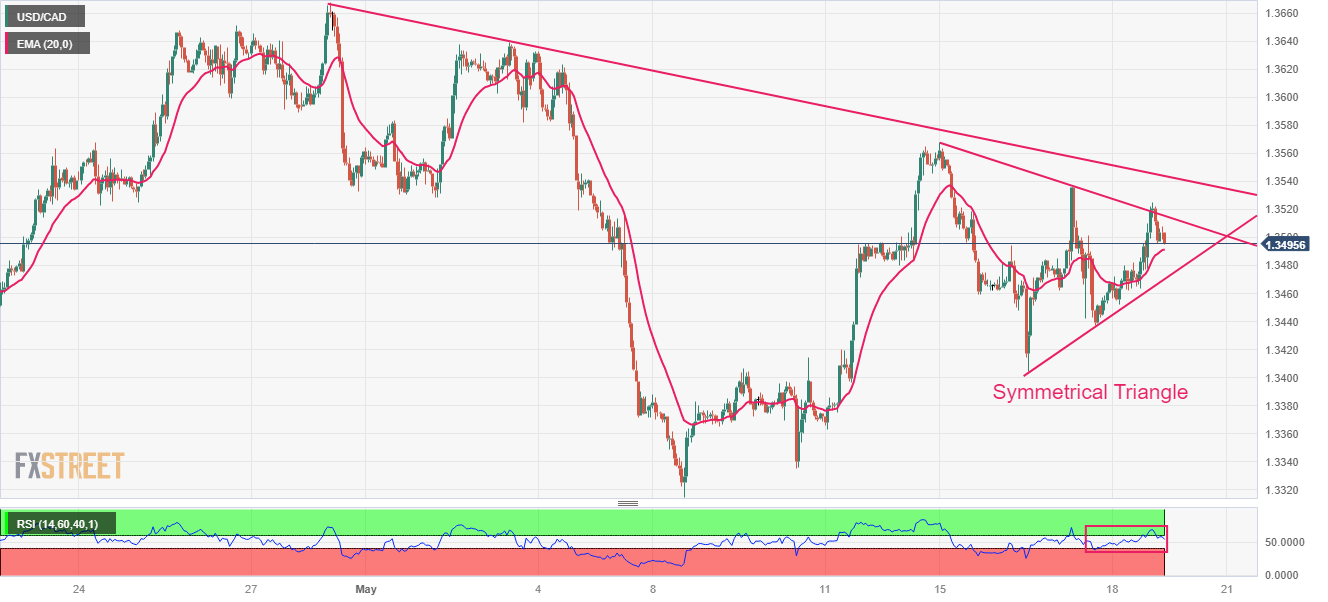
- USD/CAD is auctioning in a Symmetrical Triangle chart pattern, which indicates a volatility contraction.
The USD/CAD pair has dropped below the psychological support of 1.3500 in the early Tokyo session. The Loonie asset has sensed selling pressure as the oil price has rebounded sharply above $72.00 amid optimism over the US borrowing cap raise and the US Dollar Index (DXY) has retreated after a less-confident pullback.
Investors should note that Canada is the leading exporter of oil to the United States and a recovery in the oil price supports the Canadian Dollar.
Going forward, investors will keep an eye on monthly Canadian Retail Sales data (March). Monthly Retail Sales data is seen contracting by 1.4% vs. a contraction of 0.2% recorded earlier. A decline in househoulds’ demand would allow the Bank of Canada (BoC) to keep its interest rate policy steady further.
USD/CAD is auctioning in a Symmetrical Triangle chart pattern on an hourly scale, which indicates a volatility contraction. The Loonie asset sensed selling pressure while attempting a breakout of the neutral triangle. The downward-sloping trendline from April 28 high at 1.3668 is acting as a major barricade for the US Dollar bulls.
The 20-period Exponential Moving Average (EMA) at 1.3492 is close to the asset price, indicating a lackluster performance.
Also, the Relative Strength Index (RSI) (14) has slipped back into the 40.00-60.00 range, which signals that investors await a potential trigger for a decisive move.
The upside bias will get strengthened if the Loonie asset manages to surpass the round-level resistance of 1.3600. This will expose the asset to May 21 low at 1.3644 followed by the round-level resistance at 1.3700.
On the flip side, a break below May 18 low at 1.3452 will fade the upside bias and will drag the asset toward April 04 low at 1.3406 and May 08 low at 1.3315.
USD/CAD hourly chart


© 2000-2026. Bản quyền Teletrade.
Trang web này được quản lý bởi Teletrade D.J. LLC 2351 LLC 2022 (Euro House, Richmond Hill Road, Kingstown, VC0100, St. Vincent and the Grenadines).
Thông tin trên trang web không phải là cơ sở để đưa ra quyết định đầu tư và chỉ được cung cấp cho mục đích làm quen.
Giao dịch trên thị trường tài chính (đặc biệt là giao dịch sử dụng các công cụ biên) mở ra những cơ hội lớn và tạo điều kiện cho các nhà đầu tư sẵn sàng mạo hiểm để thu lợi nhuận, tuy nhiên nó mang trong mình nguy cơ rủi ro khá cao. Chính vì vậy trước khi tiến hành giao dịch cần phải xem xét mọi mặt vấn đề chấp nhận tiến hành giao dịch cụ thể xét theo quan điểm của nguồn lực tài chính sẵn có và mức độ am hiểu thị trường tài chính.
Sử dụng thông tin: sử dụng toàn bộ hay riêng biệt các dữ liệu trên trang web của công ty TeleTrade như một nguồn cung cấp thông tin nhất định. Việc sử dụng tư liệu từ trang web cần kèm theo liên kết đến trang teletrade.vn. Việc tự động thu thập số liệu cũng như thông tin từ trang web TeleTrade đều không được phép.
Xin vui lòng liên hệ với pr@teletrade.global nếu có câu hỏi.
ngân hàng