- Phân tích
- Tin tức và các công cụ
- Tin tức thị trường
- Silver Price Analysis: XAG/USD floats around $23.60, as high US bond yields dented
Silver Price Analysis: XAG/USD floats around $23.60, as high US bond yields dented
- Silver prices edge toward $23.60 following a dip below $24.00 last week, as US Treasury bond yields surge to 3.721%, curbing safe-haven appetite and softening the USD’s fall.
- XAG/USD holds its double-top chart pattern below the neckline. Although a failure to cross the 100-day EMA at $23.50 hints at the bullish sentiment, a bearish RSI suggests possible retesting.
- If XAG/USD breaks below the 100-day EMA, it eyes $23.00 and then the pivotal 200-day EMA at $22.82.
Silver price retraces toward the $23.60 area after falling below the $24.00 figure in the last week, courtesy of higher US Treasury bond yields, with the 10-year benchmark note rate at 3.721%, climbing more than four basis points. That dented the appetite for safe-haven assets, namely Gold and Silver prices, and cushioned the fall of the US Dollar. At the time of writing, the XAG/USD is trading at $23.62, almost flat as the Asian session begins.
XAG/USD Price Analysis: Technical outlook
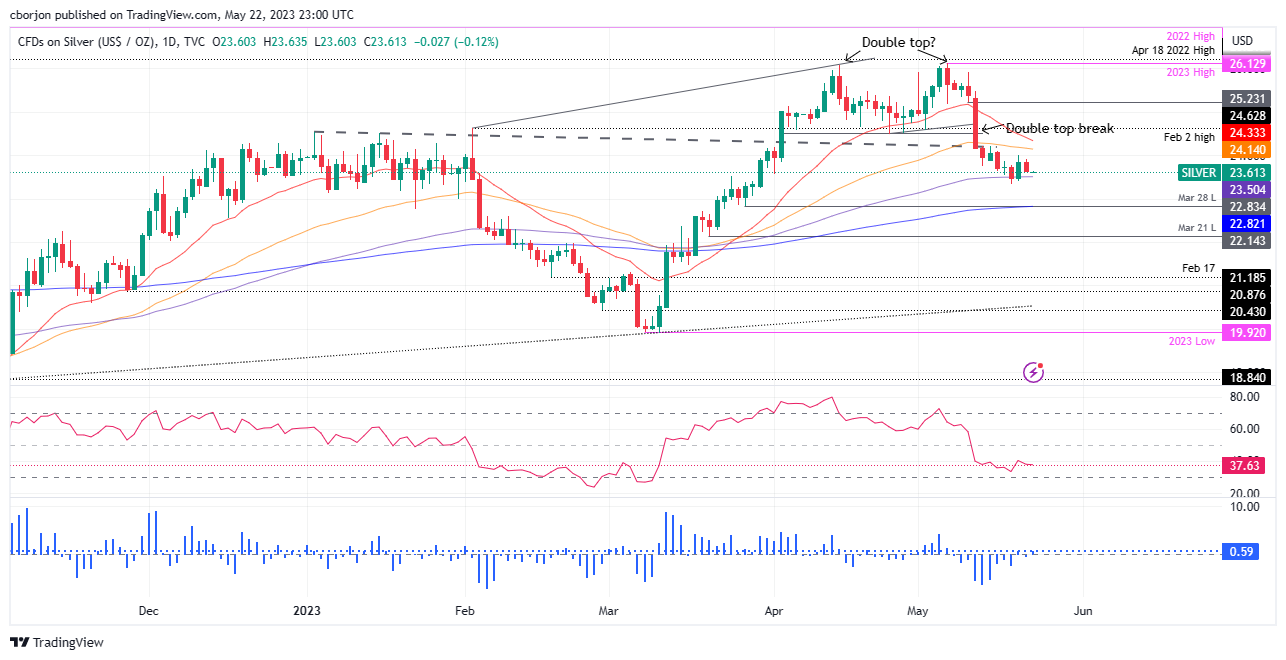
The XAG/USD continues to validate a double-top chart pattern, with the XAG/USD’s spot price remaining below the double-top neckline. Failure to break below the 100-day Exponential Moving Average (EMA) at $23.50 keeps Silver buyers hopeful for higher prices. Nevertheless, the Relative Strength Index (RSI) indicator remains bearish, suggesting that the 100-day EMA could be retested soon.
If XAG/USD breaks below the latter, the next support would be the $23.00 figure before testing the “trendsetter” 200-day EMA at $22.82. Once broken, XAG/USD will turn bearish and be exposed to test lower prices. Firstly, the March 28 daily low at $22.83, followed by the March 21 swing low of $22.14.
On the other hand, for XAG/USD’s bullish continuation, Silver must reclaim the $24.00 mark, a troy ounce, followed by the 50-day EMA at $24.14. Once cleared, XAG/USD’s next resistance would be the 20-day EMA at $24.33, ahead of double-top neckline cracking.
XAG/USD Price Action – Daily chart


© 2000-2026. Bản quyền Teletrade.
Trang web này được quản lý bởi Teletrade D.J. LLC 2351 LLC 2022 (Euro House, Richmond Hill Road, Kingstown, VC0100, St. Vincent and the Grenadines).
Thông tin trên trang web không phải là cơ sở để đưa ra quyết định đầu tư và chỉ được cung cấp cho mục đích làm quen.
Giao dịch trên thị trường tài chính (đặc biệt là giao dịch sử dụng các công cụ biên) mở ra những cơ hội lớn và tạo điều kiện cho các nhà đầu tư sẵn sàng mạo hiểm để thu lợi nhuận, tuy nhiên nó mang trong mình nguy cơ rủi ro khá cao. Chính vì vậy trước khi tiến hành giao dịch cần phải xem xét mọi mặt vấn đề chấp nhận tiến hành giao dịch cụ thể xét theo quan điểm của nguồn lực tài chính sẵn có và mức độ am hiểu thị trường tài chính.
Sử dụng thông tin: sử dụng toàn bộ hay riêng biệt các dữ liệu trên trang web của công ty TeleTrade như một nguồn cung cấp thông tin nhất định. Việc sử dụng tư liệu từ trang web cần kèm theo liên kết đến trang teletrade.vn. Việc tự động thu thập số liệu cũng như thông tin từ trang web TeleTrade đều không được phép.
Xin vui lòng liên hệ với pr@teletrade.global nếu có câu hỏi.
ngân hàng