- Phân tích
- Tin tức và các công cụ
- Tin tức thị trường
- AUD/USD Price Analysis: Rebounds sharply as Aussie PMI remains upbeat
AUD/USD Price Analysis: Rebounds sharply as Aussie PMI remains upbeat
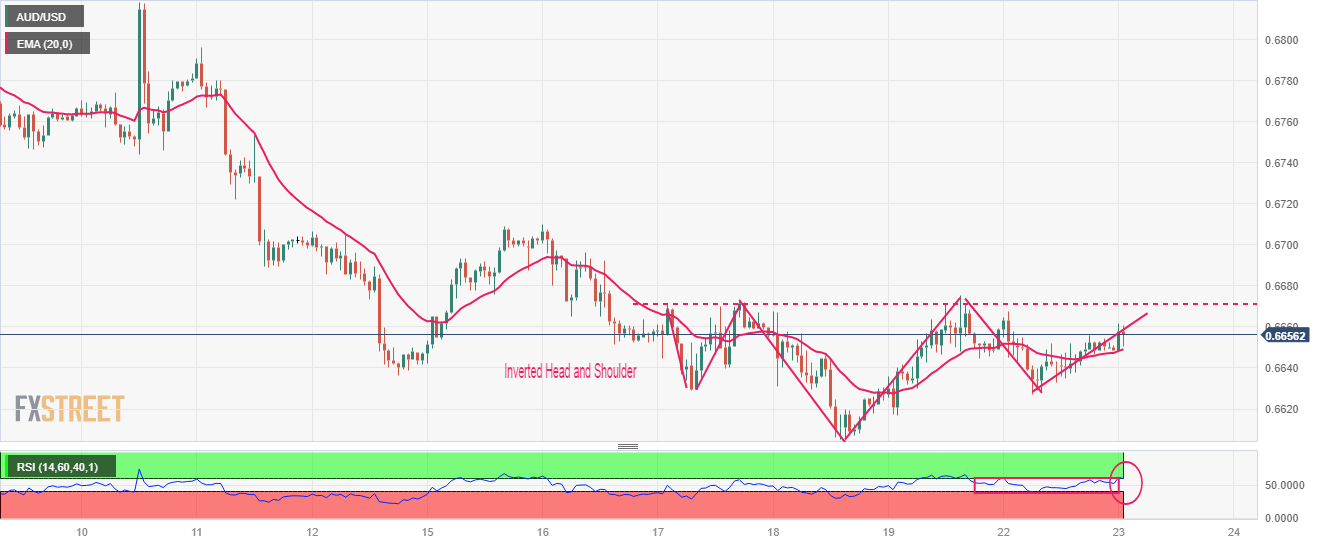
- AUD/USD has shown some resilience above 0.6650 after the release of better-than-projected Aussie PMI data.
- The USD Index has recovered its entire losses posted in early Asia despite the further delay in US debt-ceiling raise.
- AUD/USD has formed an Inverted Head and Shoulder pattern, which advocates a bullish reversal after a long consolidation.
The AUD/USD pair has shown a recovery move after correcting to near 0.6650 in the Tokyo session. The Aussie asset has gained some strength despite a solid recovery in the US Dollar Index (DXY). In spite of a further delay in the US debt-ceiling negotiations, as a meeting between US President Joe Biden and House of Speaker Kevin McCarthy ended without an agreement, the USD Index has gained traction.
The release of the upbeat preliminary Australian S&P PMI (May) has infused some strength in the Australian Dollar. Manufacturing PMI has jumped to 48.0 from the expectations of 47.3 but remained in line with the former release. Also, Services PMI outperformed estimates, landed at 51.3.
The USD Index has recovered its entire losses posted in early Asia but is facing barricades in extending its rally further.
AUD/USD has formed an Inverted Head and Shoulder chart pattern on an hourly scale, which advocates a bullish reversal after a long consolidation. The Aussie asset is expected to witness a significant upside after a breakout of the neckline plotted from May 17 high at 0.6690.
The 20-period Exponential Moving Average (EMA) at 0.6650 is providing support to the Aussie bulls.
Also, the Relative Strength Index (RSI) (14) is making efforts for shifting into the bullish range of 60.00-80.00 after which a bullish momentum will get triggered.
A confident acceptance above the neckline plotted from May 17 high at 0.6690 will send the Aussie bulls firmly toward the round-level resistance at 0.6800 followed by February 06 low at 0.6855.
In an alternate scenario, US Dollar bulls will flex their muscles if the Aussie asset will drop below March 15 low at 0.6590. An occurrence of the same will expose the asset to March 08 low at 0.6568 followed by 02 November 2022 high around 0.6500.
AUD/USD hourly chart


© 2000-2026. Bản quyền Teletrade.
Trang web này được quản lý bởi Teletrade D.J. LLC 2351 LLC 2022 (Euro House, Richmond Hill Road, Kingstown, VC0100, St. Vincent and the Grenadines).
Thông tin trên trang web không phải là cơ sở để đưa ra quyết định đầu tư và chỉ được cung cấp cho mục đích làm quen.
Giao dịch trên thị trường tài chính (đặc biệt là giao dịch sử dụng các công cụ biên) mở ra những cơ hội lớn và tạo điều kiện cho các nhà đầu tư sẵn sàng mạo hiểm để thu lợi nhuận, tuy nhiên nó mang trong mình nguy cơ rủi ro khá cao. Chính vì vậy trước khi tiến hành giao dịch cần phải xem xét mọi mặt vấn đề chấp nhận tiến hành giao dịch cụ thể xét theo quan điểm của nguồn lực tài chính sẵn có và mức độ am hiểu thị trường tài chính.
Sử dụng thông tin: sử dụng toàn bộ hay riêng biệt các dữ liệu trên trang web của công ty TeleTrade như một nguồn cung cấp thông tin nhất định. Việc sử dụng tư liệu từ trang web cần kèm theo liên kết đến trang teletrade.vn. Việc tự động thu thập số liệu cũng như thông tin từ trang web TeleTrade đều không được phép.
Xin vui lòng liên hệ với pr@teletrade.global nếu có câu hỏi.
ngân hàng