- Phân tích
- Tin tức và các công cụ
- Tin tức thị trường
- GBP/JPY Price Analysis: Clings to 172.00 on risk-off impulse, as UK’s inflation remains high
GBP/JPY Price Analysis: Clings to 172.00 on risk-off impulse, as UK’s inflation remains high
- Despite trading within a range, the GBP/JPY maintains an upward bias, bolstered by UK inflation figures and expectations of further tightening by the Bank of England.
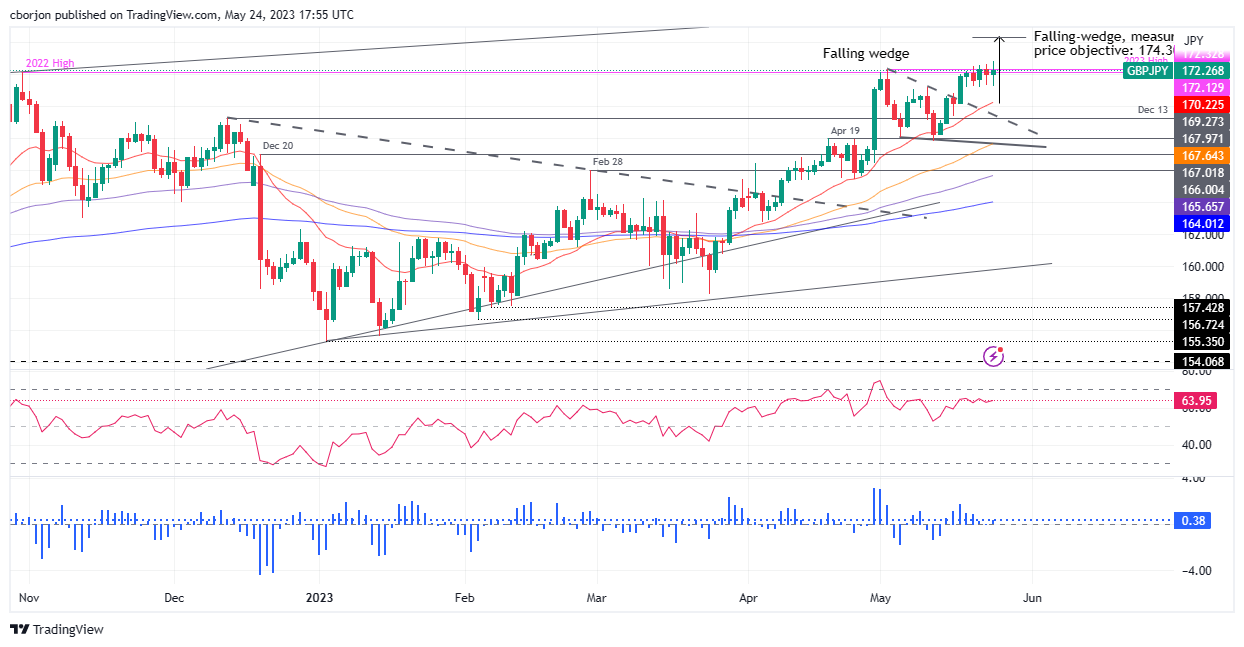
- GBP/JPY faces a potential pullback, suggested by the negative divergence between its price action and the Relative Strength Index (RSI), with support at 172.00 and the 20-day EMA at 170.27.
- Further gains may be expected if GBP/JPY surpasses 173.00, with the falling wedge measuring an objective of 174.30.
GBP/JPY clings to the 172.00 figure amidst a risk-off impulse as the US debt ceiling woes and the release of the US Federal Reserve (Fed) May minutes loom. Therefore, investors seeking safety moved toward safe-haven peers, except for the Japanese Yen (JPY), weakening against the Pound Sterling (GBP). At the time of writing, the GBP/JPY is trading around 172.30s.
GBP/JPY Price Analysis: Technical outlook
The GBP/JPY continues to trade within a range between the 171.22-172.79 area after inflation figures in the United Kingdom (UK) cooled down, except for the April Core Consumer Price Index (CPI) jumping by 6.8%, above the prior’s month and the consensus 6.2%. That underpinned the GBP as expectations for additional tightening by the Bank of England (BoE) increased.
The GBP/JPY is still upward biased, but since the break of a falling wedge, the pair’s rally towards the measured objective at 174.30 stalled. In n article written on May 23, I wrote: “After three consecutive sessions, the GBP/JPY failed to reach the 173.00 area, which, once cleared, could pave the way towards the 174.00 figure, ahead of getting the measured objective of the falling wedge.” However, Wednesday what no exception to the rule, as the GBP/JPY reached a high of 172.79 but retreated more than 50 pips, oscillating around 172.20s.
As the GBP/JPY price action achieved successive higher highs, the Relative Strength Index (RSI) indicator prints lower peaks. That means a negative divergence between price action and the RSI could open the door for a pullback.
Hence, the GBP/JPY first support is the 172.00 mark. A break below and the GBP/JPY will reach the 20-day Exponential Moving Average (EMA) at 170.27, with the 170.00 figure up for grabs.
On the flip side, if GBP/JPY hits 173.00, that could pave the way for further gains, lile the falling wedge measured an objective of 174.30.
GBP/JPY Price Action – Daily chart


© 2000-2026. Bản quyền Teletrade.
Trang web này được quản lý bởi Teletrade D.J. LLC 2351 LLC 2022 (Euro House, Richmond Hill Road, Kingstown, VC0100, St. Vincent and the Grenadines).
Thông tin trên trang web không phải là cơ sở để đưa ra quyết định đầu tư và chỉ được cung cấp cho mục đích làm quen.
Giao dịch trên thị trường tài chính (đặc biệt là giao dịch sử dụng các công cụ biên) mở ra những cơ hội lớn và tạo điều kiện cho các nhà đầu tư sẵn sàng mạo hiểm để thu lợi nhuận, tuy nhiên nó mang trong mình nguy cơ rủi ro khá cao. Chính vì vậy trước khi tiến hành giao dịch cần phải xem xét mọi mặt vấn đề chấp nhận tiến hành giao dịch cụ thể xét theo quan điểm của nguồn lực tài chính sẵn có và mức độ am hiểu thị trường tài chính.
Sử dụng thông tin: sử dụng toàn bộ hay riêng biệt các dữ liệu trên trang web của công ty TeleTrade như một nguồn cung cấp thông tin nhất định. Việc sử dụng tư liệu từ trang web cần kèm theo liên kết đến trang teletrade.vn. Việc tự động thu thập số liệu cũng như thông tin từ trang web TeleTrade đều không được phép.
Xin vui lòng liên hệ với pr@teletrade.global nếu có câu hỏi.
ngân hàng