- Phân tích
- Tin tức và các công cụ
- Tin tức thị trường
- US Dollar Index: Extends four-day rally, bulls' eye the 105.000 mark
US Dollar Index: Extends four-day rally, bulls' eye the 105.000 mark
- The US Dollar Index continues its climb, currently trading above 104.000, driven by robust US Treasury bond yields.
- A third consecutive daily close above the 200-day EMA could solidify a bullish outlook, putting 105.000 within reach.
- Downside risks persist, with a potential fall towards 103.000 if the DXY drops below the 200-day EMA.
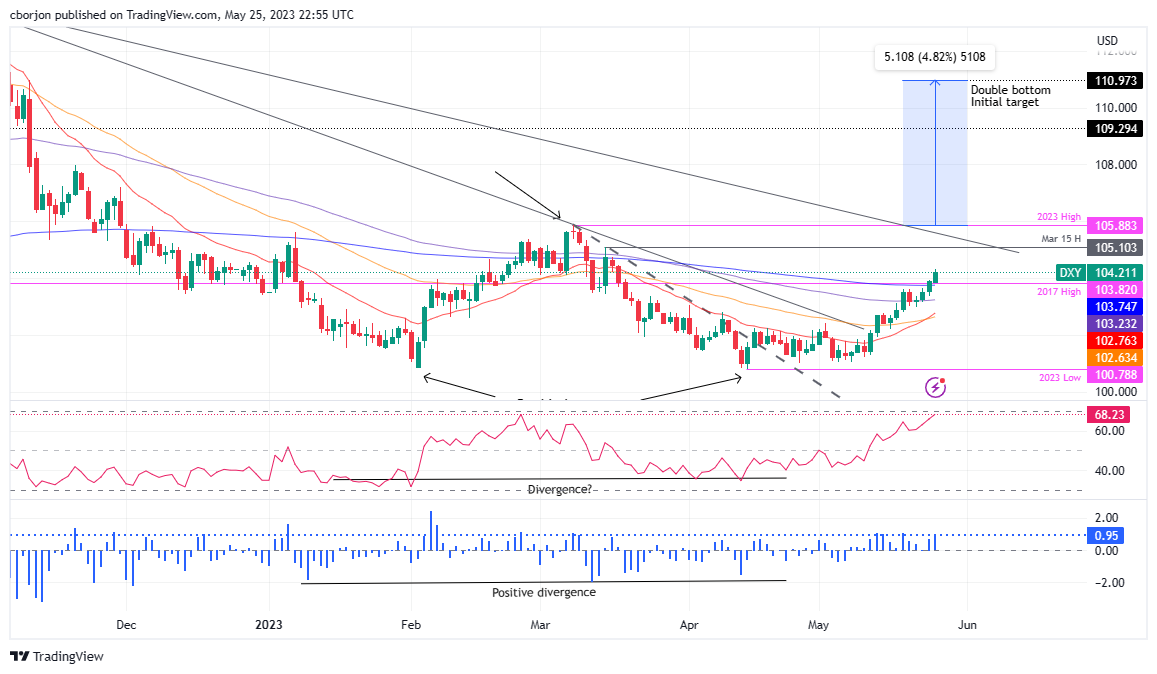
The US Dollar Index (DXY), which measures a basket of six currencies against the US Dollar (USD), extended its rally to four consecutive days, distances from the 200-day Exponential Moving Average (EMA) at 103.743, claimed on May 24, underpinned by high US Treasury bond yields. At the time of writing, the DXY is trading hands at 104.211, gaining 0.31%, with bulls eyeing the 105.000 mark.
US Dollar Index Price Analysis: Technical outlook
On Wednesday, I wrote, “The US Dollar Index is neutral to bullish biased, but it could cement its bias as bullish once the DXY achieves a decisive break above the 200-day EMA.” For two consecutive days, the DXY stays above the latter suggesting that bulls are gathering momentum. Nevertheless, a third daily close above the 200-day EMA could cement the bias as bullish, and with the double-bottom in play, the 105.000 is up for grabs.
Must read:
- US Dollar Index: Could a double bottom at the weekly chart drive the DXY to 111.000?
- US Dollar Index: Reclaims 200-day EMA, surpasses 2017 yearly high, as bulls stepped in eyeing 104.000
If the US Dollar Index claims the year-to-date (YTD) high of 105.883, that will validate the double-bottom chart pattern, but the buck must surpass crucial resistance levels on its uptrend. Meanwhile, the Relative Strength Index (RSI) indicator is in bullish territory, with some room before hitting overbought levels, while the 3-day Rate of Change (RoC) suggests that buyers are in charge.
If the DXY reclaims 104.000, the next resistance level to test would be the March 15 daily high of 105.103. Break above, and the DXY will have a clear run toward testing an eight-month-old resistance trendline around the 105.300-600 area, ahead of piercing the YTD high at 105.883
Downside risks for the DXY remain below the 200-day EMA, which could send the greenback sliding towards the 100-day EMA at 103.212. A clear break will send the DXY toward the May 22 swing low of 102.964, slightly below the 103.000 mark.
US Dollar Index Price Action – Daily chart


© 2000-2026. Bản quyền Teletrade.
Trang web này được quản lý bởi Teletrade D.J. LLC 2351 LLC 2022 (Euro House, Richmond Hill Road, Kingstown, VC0100, St. Vincent and the Grenadines).
Thông tin trên trang web không phải là cơ sở để đưa ra quyết định đầu tư và chỉ được cung cấp cho mục đích làm quen.
Giao dịch trên thị trường tài chính (đặc biệt là giao dịch sử dụng các công cụ biên) mở ra những cơ hội lớn và tạo điều kiện cho các nhà đầu tư sẵn sàng mạo hiểm để thu lợi nhuận, tuy nhiên nó mang trong mình nguy cơ rủi ro khá cao. Chính vì vậy trước khi tiến hành giao dịch cần phải xem xét mọi mặt vấn đề chấp nhận tiến hành giao dịch cụ thể xét theo quan điểm của nguồn lực tài chính sẵn có và mức độ am hiểu thị trường tài chính.
Sử dụng thông tin: sử dụng toàn bộ hay riêng biệt các dữ liệu trên trang web của công ty TeleTrade như một nguồn cung cấp thông tin nhất định. Việc sử dụng tư liệu từ trang web cần kèm theo liên kết đến trang teletrade.vn. Việc tự động thu thập số liệu cũng như thông tin từ trang web TeleTrade đều không được phép.
Xin vui lòng liên hệ với pr@teletrade.global nếu có câu hỏi.
ngân hàng