- Phân tích
- Tin tức và các công cụ
- Tin tức thị trường
- Gold Price Forecast: XAU/USD rebound appears elusive within $1,951-43 range – Confluence Detector
Gold Price Forecast: XAU/USD rebound appears elusive within $1,951-43 range – Confluence Detector
- Gold Price portrays corrective bounce on the way to posting three-week downtrend.
- Cautious mood amid looming US debt ceiling expiry, key US data allow US Dollar to retreat, underpin XAU/USD’s bounce.
- Upbeat US statistics, hawkish Fed concerns join hopes of no US default, despite all drama, to keep Gold bears hopeful.
Gold Price (XAU/USD) pares weekly losses at the lowest levels in two months as markets await the key US data, as well as the debt ceiling deal. The precious metal’s latest rebound could be linked to the US Dollar’s retreat from a multi-day top as the latest headlines suggest that the policymakers still have sizeable differences to cut to avoid the US default. Even so, upwardly revised US Real GDP and activity data underpin hawkish hopes surrounding the Federal Reserve, despite mixed comments from the Officials of late, which in turn exert downside pressure on the XAU/USD.
Moving on, US debt ceiling negotiations will be crucial to gauge the market moves as the early June deadline looms. Further, the US Durable Goods Orders for April and the Core Personal Consumption Expenditure (PCE) Price Index for the said month, known as the Fed’s preferred inflation gauge, should also be watched carefully for clear directions.
Also read: Gold Price Forecast: XAU/USD eyes US PCE inflation and a weekly close below 100 DMA
Gold Price: Key levels to watch
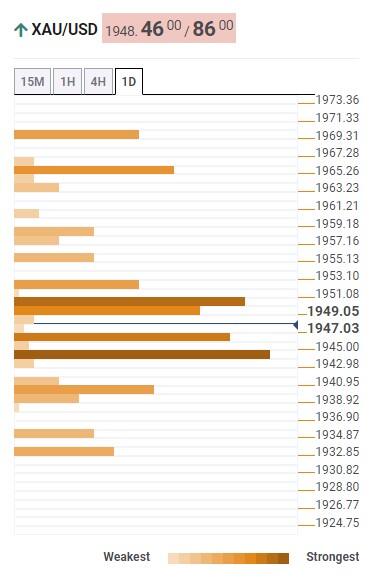
As per the out Technical Confluence Indicator, the Gold Price grinds within a short-term trading range around the multi-day low.
That said, the $1,943 appears the key support for the XAU/USD bear’s re-entry as it comprises a slew of technical indicators namely the Pivot Point one-month S1, previous high on four-hour (4H) and the middle band of the Bollinger on the 15-minute timeframe.
Following that, the lower band of the Bollinger on the one-day and four-hour timeframes, around $1,938, can act as the last defense of the Gold buyers.
It should be noted that a convergence of the Fibonacci 23.6% on one-day and Pivot Point one-week S1 restricts the immediate downside of the XAU/USD near $1,945.
Meanwhile, the quote’s recovery moves need validation from the previous monthly low of around $1,951.
In a case where the Gold Price remains firmer past $1,951, the odds of witnessing a run-up towards the $1,967 hurdle encompassing the 100-HMA, 5-DMA and previous daily high can’t be ruled out.
Given the XAU/USD run-up past $1,967, the Fibonacci 23.6% on one-week around $1,971 can try to defend the castle with one hand.
Here is how it looks on the tool
About Technical Confluences Detector
The TCD (Technical Confluences Detector) is a tool to locate and point out those price levels where there is a congestion of indicators, moving averages, Fibonacci levels, Pivot Points, etc. If you are a short-term trader, you will find entry points for counter-trend strategies and hunt a few points at a time. If you are a medium-to-long-term trader, this tool will allow you to know in advance the price levels where a medium-to-long-term trend may stop and rest, where to unwind positions, or where to increase your position size


© 2000-2026. Bản quyền Teletrade.
Trang web này được quản lý bởi Teletrade D.J. LLC 2351 LLC 2022 (Euro House, Richmond Hill Road, Kingstown, VC0100, St. Vincent and the Grenadines).
Thông tin trên trang web không phải là cơ sở để đưa ra quyết định đầu tư và chỉ được cung cấp cho mục đích làm quen.
Giao dịch trên thị trường tài chính (đặc biệt là giao dịch sử dụng các công cụ biên) mở ra những cơ hội lớn và tạo điều kiện cho các nhà đầu tư sẵn sàng mạo hiểm để thu lợi nhuận, tuy nhiên nó mang trong mình nguy cơ rủi ro khá cao. Chính vì vậy trước khi tiến hành giao dịch cần phải xem xét mọi mặt vấn đề chấp nhận tiến hành giao dịch cụ thể xét theo quan điểm của nguồn lực tài chính sẵn có và mức độ am hiểu thị trường tài chính.
Sử dụng thông tin: sử dụng toàn bộ hay riêng biệt các dữ liệu trên trang web của công ty TeleTrade như một nguồn cung cấp thông tin nhất định. Việc sử dụng tư liệu từ trang web cần kèm theo liên kết đến trang teletrade.vn. Việc tự động thu thập số liệu cũng như thông tin từ trang web TeleTrade đều không được phép.
Xin vui lòng liên hệ với pr@teletrade.global nếu có câu hỏi.
ngân hàng