- Phân tích
- Tin tức và các công cụ
- Tin tức thị trường
- USD/INR Price Analysis: Indian Rupee bears occupy driver’s seat within falling wedge, 82.75 is the key
USD/INR Price Analysis: Indian Rupee bears occupy driver’s seat within falling wedge, 82.75 is the key
- USD/INR picks up bids to extend the previous day’s rebound inside bullish chart formation.
- 50-SMA adds strength to 82.75 hurdle for Indian Rupee bears.
- April’s peak, 200-SMA restrict short-term downside of USD/INR pair.
- US Dollar grinds higher amid default jitters, full markets’ reaction to US debt ceiling deal.
USD/INR remains on the front foot around 82.67 amid the initial hour of the Indian trading session on Tuesday. With this, the Indian Rupee (INR) pair portrays the market’s favor to the US Dollar amid anxiety ahead of the key US jobs report, as well as due to the mixed concerns about the US debt ceiling agreement and its capacity to become the law.
Amid these plays, the US stock futures print mild gains but the Treasury bond yields remain pressured and challenge the US Dollar Index (DXY) bulls as the greenback’s gauge versus the six major currencies seesaws around a nine-week high.
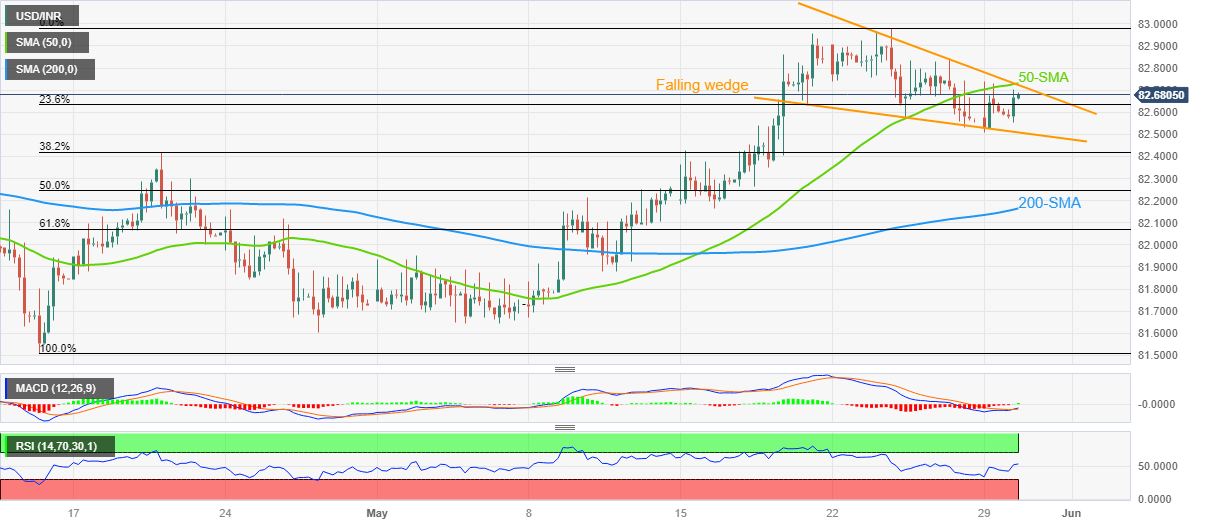
Technically, the USD/INR pair portrays a falling wedge bullish chart formation on the four-hour play, recently approaching the top line of the stated pattern.
It’s worth noting that the recently bullish MACD signals and upbeat RSI (14) line, not overbought, underpin the USD/INR pair’s latest run-up targeting the confirmation of the falling wedge by crossing the 82.75 resistance. Adding strength to the 82.75 hurdle is the 50-bar Simple Moving Average (SMA).
In a case where the USD/INR pair remains strong past 82.75, the monthly peak of around 83.00 may prod the buyers during the theoretical target of the wedge breakout, near 83.25.
Meanwhile, the USD/INR pair’s downside remains limited unless the quote stays beyond the aforementioned wedge’s bottom line, close to 82.50 at the latest.
Even if the USD/INR drops below 82.50, the 200-SMA level of around 82.15 can act as the last defense of the Indian Rupee sellers. It should be observed late April 20 peak of 82.41 also challenges the USD/INR bears.
USD/INR: Four-hour chart
Trend: Further upside expected


© 2000-2026. Bản quyền Teletrade.
Trang web này được quản lý bởi Teletrade D.J. LLC 2351 LLC 2022 (Euro House, Richmond Hill Road, Kingstown, VC0100, St. Vincent and the Grenadines).
Thông tin trên trang web không phải là cơ sở để đưa ra quyết định đầu tư và chỉ được cung cấp cho mục đích làm quen.
Giao dịch trên thị trường tài chính (đặc biệt là giao dịch sử dụng các công cụ biên) mở ra những cơ hội lớn và tạo điều kiện cho các nhà đầu tư sẵn sàng mạo hiểm để thu lợi nhuận, tuy nhiên nó mang trong mình nguy cơ rủi ro khá cao. Chính vì vậy trước khi tiến hành giao dịch cần phải xem xét mọi mặt vấn đề chấp nhận tiến hành giao dịch cụ thể xét theo quan điểm của nguồn lực tài chính sẵn có và mức độ am hiểu thị trường tài chính.
Sử dụng thông tin: sử dụng toàn bộ hay riêng biệt các dữ liệu trên trang web của công ty TeleTrade như một nguồn cung cấp thông tin nhất định. Việc sử dụng tư liệu từ trang web cần kèm theo liên kết đến trang teletrade.vn. Việc tự động thu thập số liệu cũng như thông tin từ trang web TeleTrade đều không được phép.
Xin vui lòng liên hệ với pr@teletrade.global nếu có câu hỏi.
ngân hàng