- Phân tích
- Tin tức và các công cụ
- Tin tức thị trường
- Gold Price Forecast: XAU/USD juggles around $1,960 after a rally inspired by US Dollar’s correction
Gold Price Forecast: XAU/USD juggles around $1,960 after a rally inspired by US Dollar’s correction
- Gold price is consolidating around $1,960.00 after a vertical rally ahead of US Employment.
- The USD Index witnessed intense selling pressure after printing a fresh 10-week high at 104.50.
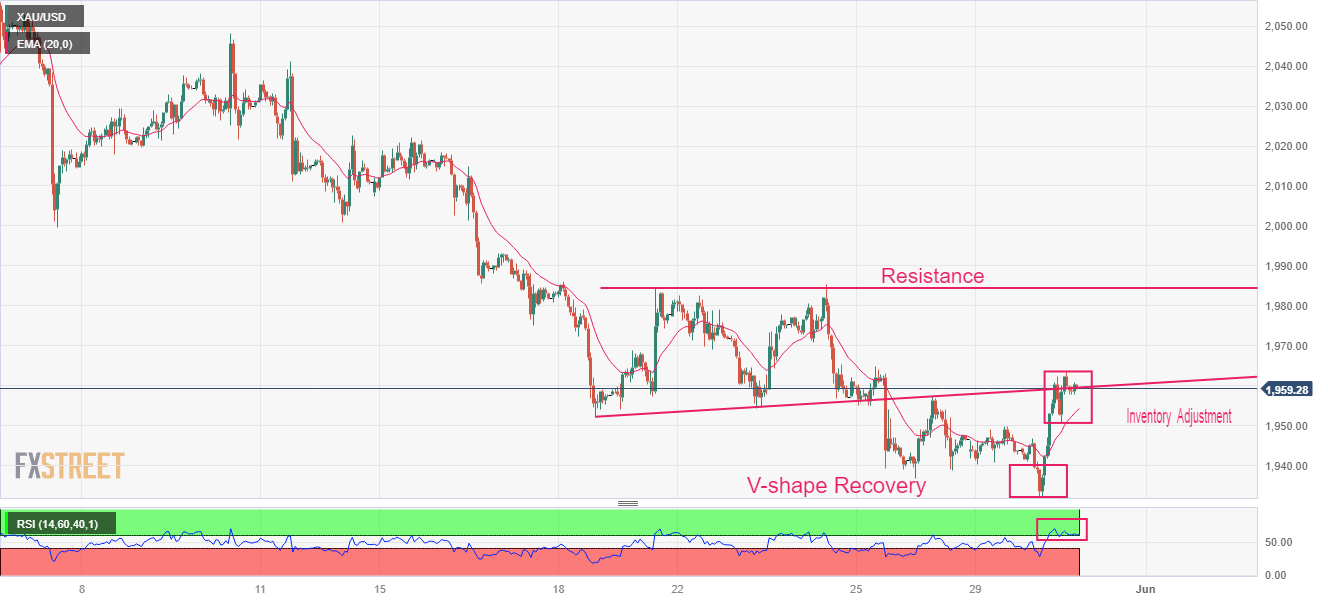
- Gold price is gathering strength for a breakout above the trendline plotted from $1,952.00.
Gold price (XAU/USD) has turned sideways around $1,960.00 after failing to extend a rally above $1,963.70 in the early Asian session. A quick rally in the Gold price came after a vertical sell-off in the US Dollar Index (DXY). The USD Index witnessed intense selling pressure after printing a fresh 10-week high at 104.50.
S&P500 ended flat on Tuesday despite after an extended weekend, portraying a cautious market mood. Sheer volatility in the US equities cannot be ruled out ahead of the United States Employment data, which will build a base for June‘s monetary policy meeting by the Federal Reserve (Fed).
Despite a sell-off in the USD Index, investors are confident that the asset could be rerated ahead as one more interest rate hike by the Fed is yet to be discounted. Consumer spending has rebounded dramatically in April and now decent caliber in labor market conditions could force Fed chair Jerome Powell to look for raising interest rates further without any doubt.
On Thursday, US Automatic Data Processing (ADP) Employment data will be keenly watched. As per the consensus, the US economy added 170K jobs in May, lower than the prior addition of 296K. Later on Friday, US Nonfarm Payrolls (NFP) will release, which will provide comprehensive information about the US labor market.
Gold technical analysis
Gold price showed a V-shape recovery after dropping to near $1,932.12 on an hourly scale. The asset is gathering strength for a breakout above the trendline plotted from May 18 low around $1,952.00, which acted as a resistance for the Gold price earlier. Meanwhile, the horizontal resistance is plotted from May 19 high at $1,984.25.
Upward sloping 20-period Exponential Moving Average (EMA) at $1,954.50 indicates that the short-term trend has turned positive.
The Relative Strength Index (RSI) (14) has shifted into the bullish range of 60.00-80.00, which indicates that the upside momentum is active.
Gold hourly chart


© 2000-2026. Bản quyền Teletrade.
Trang web này được quản lý bởi Teletrade D.J. LLC 2351 LLC 2022 (Euro House, Richmond Hill Road, Kingstown, VC0100, St. Vincent and the Grenadines).
Thông tin trên trang web không phải là cơ sở để đưa ra quyết định đầu tư và chỉ được cung cấp cho mục đích làm quen.
Giao dịch trên thị trường tài chính (đặc biệt là giao dịch sử dụng các công cụ biên) mở ra những cơ hội lớn và tạo điều kiện cho các nhà đầu tư sẵn sàng mạo hiểm để thu lợi nhuận, tuy nhiên nó mang trong mình nguy cơ rủi ro khá cao. Chính vì vậy trước khi tiến hành giao dịch cần phải xem xét mọi mặt vấn đề chấp nhận tiến hành giao dịch cụ thể xét theo quan điểm của nguồn lực tài chính sẵn có và mức độ am hiểu thị trường tài chính.
Sử dụng thông tin: sử dụng toàn bộ hay riêng biệt các dữ liệu trên trang web của công ty TeleTrade như một nguồn cung cấp thông tin nhất định. Việc sử dụng tư liệu từ trang web cần kèm theo liên kết đến trang teletrade.vn. Việc tự động thu thập số liệu cũng như thông tin từ trang web TeleTrade đều không được phép.
Xin vui lòng liên hệ với pr@teletrade.global nếu có câu hỏi.
ngân hàng