- Phân tích
- Tin tức và các công cụ
- Tin tức thị trường
- NZD/USD Price Analysis: Dives below 0.6020 on mixed China’s official PMI data
NZD/USD Price Analysis: Dives below 0.6020 on mixed China’s official PMI data
- NZD/USD has sharply dived below 0.6020 amid mixed China’s Official PMI data.
- China’s Manufacturing PMI at 48.8, lower than the estimates of 49.4 while Non-Manufacturing PMI jumped to 54.5 vs. 50.7.
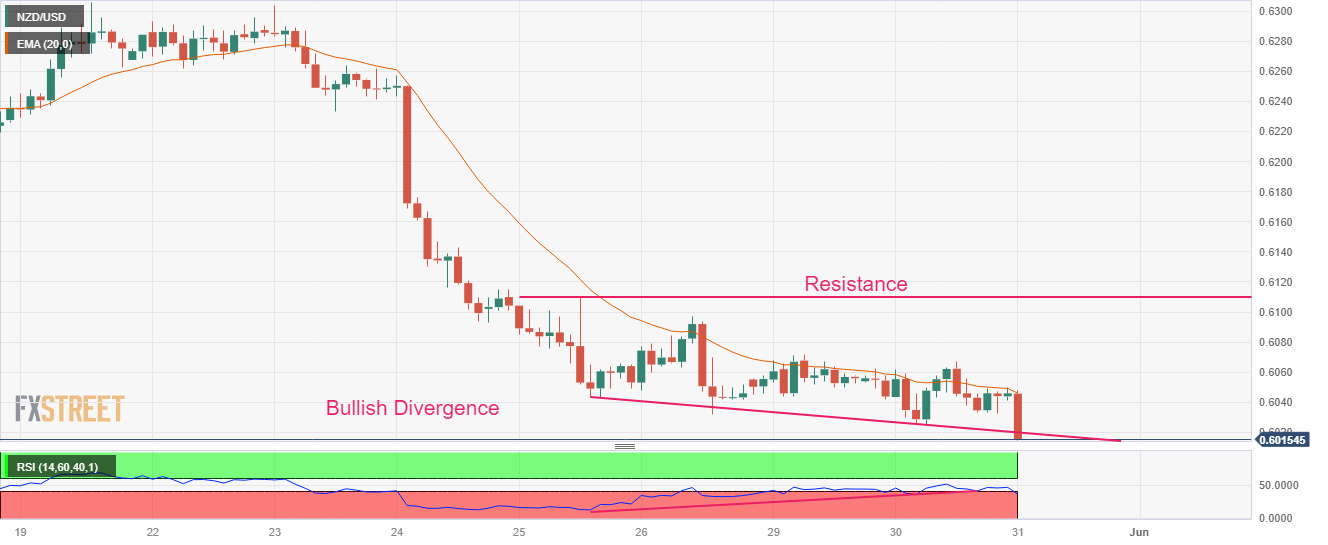
- NZD/USD has formed a Bullish Divergence which indicates exhaustion in the downside momentum.
The NZD/USD pair has tumbled to near 0.6016 after the release of mixed China’s official PMI data (May). China’s National Bureau of Statistics (NBS) has reported Manufacturing PMI at 48.8, lower than the estimates of 49.4 and the former release of 49.2. While Non-Manufacturing PMI jumped to 54.5 from the consensus of 50.7 but remained lower than the former figure of 56.4.
The US Dollar Index (DXY) has extended its retreat move further below 104.04 as an approval of a raise in the US debt-ceiling has weakened its appeal. Going forward, the USD Index will be guided by the release of the US Automatic Data Processing (ADP) Employment Change data.
Going forward, New Zealand Dollar will continue its action ahead of the release of the Caixin Manufacturing PMI data (May). As per the consensus, the economic data is seen steady at 49.5. It is worth noting that New Zealand is one of the leading trading partners of China and a stagnant China's factory performance could impact the New Zealand Dollar.
NZD/USD has formed a Bullish Divergence on a two-hour scale, which indicates exhaustion in the downside momentum. The Kiwi asset was consistently making lower lows while the momentum oscillator Relative Strength Index (RSI) (14) made higher lows. The bullish divergence would get triggered after a decisive break above the crucial resistance of 0.6070.
The 20-period Exponential Moving Average (EMA) at 0.6048 is still acting as a barricade for the New Zealand Dollar bulls.
A confident break above the immediate resistance of 0.6070 will drive the Kiwi asset toward the horizontal resistance plotted from May 25 high at 0.6110 followed by May 01 low at 0.6160.
On the flip side, a downside move below the intraday low at 0.6015 will expose the asset for a fresh six-month low toward 11 November 2022 low at 0.5984. A slippage below the latter would expose the asset toward 02 November 2022 high at 0.5941.
NZD/USD two-hour chart


© 2000-2026. Bản quyền Teletrade.
Trang web này được quản lý bởi Teletrade D.J. LLC 2351 LLC 2022 (Euro House, Richmond Hill Road, Kingstown, VC0100, St. Vincent and the Grenadines).
Thông tin trên trang web không phải là cơ sở để đưa ra quyết định đầu tư và chỉ được cung cấp cho mục đích làm quen.
Giao dịch trên thị trường tài chính (đặc biệt là giao dịch sử dụng các công cụ biên) mở ra những cơ hội lớn và tạo điều kiện cho các nhà đầu tư sẵn sàng mạo hiểm để thu lợi nhuận, tuy nhiên nó mang trong mình nguy cơ rủi ro khá cao. Chính vì vậy trước khi tiến hành giao dịch cần phải xem xét mọi mặt vấn đề chấp nhận tiến hành giao dịch cụ thể xét theo quan điểm của nguồn lực tài chính sẵn có và mức độ am hiểu thị trường tài chính.
Sử dụng thông tin: sử dụng toàn bộ hay riêng biệt các dữ liệu trên trang web của công ty TeleTrade như một nguồn cung cấp thông tin nhất định. Việc sử dụng tư liệu từ trang web cần kèm theo liên kết đến trang teletrade.vn. Việc tự động thu thập số liệu cũng như thông tin từ trang web TeleTrade đều không được phép.
Xin vui lòng liên hệ với pr@teletrade.global nếu có câu hỏi.
ngân hàng