- Phân tích
- Tin tức và các công cụ
- Tin tức thị trường
- Gold Price Forecast: XAU/USD slips due to rising US bond yields, global economic concerns
Gold Price Forecast: XAU/USD slips due to rising US bond yields, global economic concerns
- Gold prices decline, hindered by rising US bond yields and the greenback’s resilience; XAU/USD is down 0.50%.
- Gloomy global economic outlook impacts sentiment, with disappointing export data from China and broadened US trade deficit.
- The US dollar gains momentum as the US Dollar Index (DXY) pares earlier losses, adding pressure on gold prices.
Gold price retraces after facing solid resistance at the confluence of technical indicators, as well as weighed by rising US Treasury bond yields and a gloomy global economic outlook, with China’s export falling more than estimates. The XAU/USD is trading at $1952.36, down 0.50%, after hitting a daily high of $1970.15.
Resilient USD and risk aversion adds to XAU’s downward pressure; the US trade deficit widens
XAU/USD is on the defensive, weighed by high US bond yields, with the 10-year benchmark note climbing more than ten bps, at 3.774%. US real yields are heading towards the 1.60% region, a headwind for the yellow metal. China’s data revealed that Exports declined 7.5% YoY in US Dollar terms, below estimates for a 1.8% drop; meanwhile, Imports fell a less-than-forecasts at 4.5% YoY in May, vs. an 8.1% plunge.
The greenback shifted positively, printing gains as shown by the US Dollar Index (DXY). The DXY, which tracks the USD performance against a basket of six currencies, pares its earlier losses, up 0.04%, at 104.078.
Risk aversion is another factor impacting Gold prices as Wall Street tumbles. The trade deficit in the United States broadened, as reported by the Bureau of Economic Analysis (BEA), mainly attributed to A notable dip in exports contributed to this shift, while imports rose sharply. The Balance of Trade came at $-74.6B in April of 2023, vs. March’s $-60.B. Exports declined compared to April, came at $249B vs. $258.2B, while imports rose by $323B above March’s $318.8B.
Gold Price Analysis: XAU/USD Technical Outlook
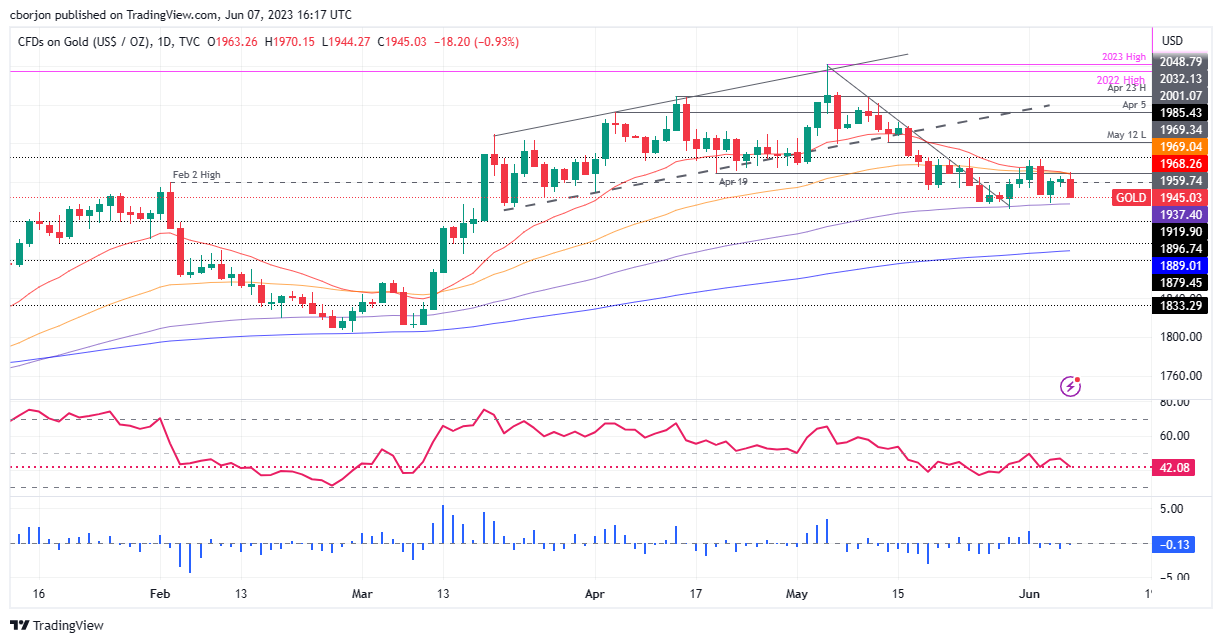
XAU/USD remains consolidated, capped within the boundaries delineated by the 20 and 100-day Exponential Moving Averages (EMAs), each at $1968.35 and $1937.43. The Relative Strength Index (RSI) indicator remains in bearish territory, while the 3-day Rate of Change (RoC) confirms a bearish bias in the near term. Therefore, the XAU/USD first support would be the 100-day EMA, followed by the $1900 figure. A breach of the latter will expose the 200-day EMA at $1889.01. Conversely, if XAU/USD buyers reclaim the confluence of the 20 and 50-day EMA at around $1968-$1970, that would open the door for a rally toward the $2000 mark.


© 2000-2026. Bản quyền Teletrade.
Trang web này được quản lý bởi Teletrade D.J. LLC 2351 LLC 2022 (Euro House, Richmond Hill Road, Kingstown, VC0100, St. Vincent and the Grenadines).
Thông tin trên trang web không phải là cơ sở để đưa ra quyết định đầu tư và chỉ được cung cấp cho mục đích làm quen.
Giao dịch trên thị trường tài chính (đặc biệt là giao dịch sử dụng các công cụ biên) mở ra những cơ hội lớn và tạo điều kiện cho các nhà đầu tư sẵn sàng mạo hiểm để thu lợi nhuận, tuy nhiên nó mang trong mình nguy cơ rủi ro khá cao. Chính vì vậy trước khi tiến hành giao dịch cần phải xem xét mọi mặt vấn đề chấp nhận tiến hành giao dịch cụ thể xét theo quan điểm của nguồn lực tài chính sẵn có và mức độ am hiểu thị trường tài chính.
Sử dụng thông tin: sử dụng toàn bộ hay riêng biệt các dữ liệu trên trang web của công ty TeleTrade như một nguồn cung cấp thông tin nhất định. Việc sử dụng tư liệu từ trang web cần kèm theo liên kết đến trang teletrade.vn. Việc tự động thu thập số liệu cũng như thông tin từ trang web TeleTrade đều không được phép.
Xin vui lòng liên hệ với pr@teletrade.global nếu có câu hỏi.
ngân hàng