- Phân tích
- Tin tức và các công cụ
- Tin tức thị trường
- EUR/USD Price Analysis: Upside seems limited, bearish pennant in the making
EUR/USD Price Analysis: Upside seems limited, bearish pennant in the making
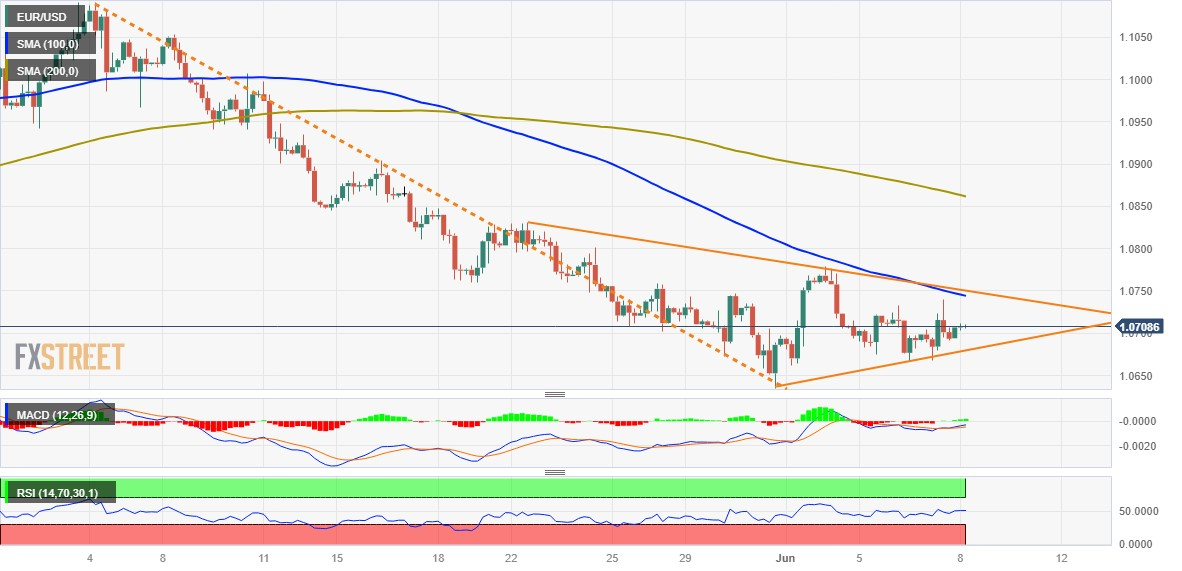
- EUR/USD edges higher and retakes the 1.0700 mark during the Asian session on Thursday.
- A mildly softer tone around the USD is seen as a key factor lending support to the major.
- The formation of a bearish pennant warrants caution before positioning for further gains.
The EUR/USD pair attracts some buying following the overnight pullback from the weekly high and climbs back above the 1.0700 mark during the Asian session on Thursday.
The uncertainty over the Federal Reserve's (Fed) rate-hike path keeps the US Dollar (USD) bulls on the defensive, which, in turn, is seen lending some support to the EUR/USD pair. That said, surprise rate hikes by the Reserve Bank of Australia (RBA) and the Bank of Canada (BoC) this week suggest that the fight against inflation is not over yet. This supports prospects for a further policy tightening by the Fed, which remains supportive of elevated US Treasury bond yields and favours the USD bulls.
From a technical perspective, the recent price action between two converging trend lines constitutes the formation of a bearish pennant on hourly charts. This comes on the back of the recent breakdown through the 100-day Simple Moving Average (SMA) and suggests that the path of least resistance for the EUR/USD pair is to the downside. Bearish traders, however, need to wait for weakness below the symmetrical triangle support, currently near the 1.0680-1.0675 region, before placing fresh bets.
The latter is followed by the 1.0635 area, or over a two-month low touched last week, and the 1.0600 round-figure mark. Some follow-through selling will be seen as a fresh trigger for bearish traders and drag the EUR/USD pair towards intermediate support near the 1.0540-1.0535 area en route to the 1.0500 psychological mark. The latter coincides with the very important 200-day SMA and should help protect any further losses ahead of the highly-anticipated FOMC meeting next week.
On the flip side, the top end of the aforementioned symmetrical triangle, currently around the 1.0745-1.0750 area, coincides with the 100-period SMA on the 4-hour chart. A convincing breakthrough could trigger a short-covering rally and allow the EUR/USD pair to reclaim the 1.0800 mark. The upward trajectory could get extended further towards testing the next relevant hurdle near the 1.0865-1.0870 region, representing the 200-period SMA on the 4-hour chart.
EUIR/USD 4-hour chart
Key levels to watch


© 2000-2026. Bản quyền Teletrade.
Trang web này được quản lý bởi Teletrade D.J. LLC 2351 LLC 2022 (Euro House, Richmond Hill Road, Kingstown, VC0100, St. Vincent and the Grenadines).
Thông tin trên trang web không phải là cơ sở để đưa ra quyết định đầu tư và chỉ được cung cấp cho mục đích làm quen.
Giao dịch trên thị trường tài chính (đặc biệt là giao dịch sử dụng các công cụ biên) mở ra những cơ hội lớn và tạo điều kiện cho các nhà đầu tư sẵn sàng mạo hiểm để thu lợi nhuận, tuy nhiên nó mang trong mình nguy cơ rủi ro khá cao. Chính vì vậy trước khi tiến hành giao dịch cần phải xem xét mọi mặt vấn đề chấp nhận tiến hành giao dịch cụ thể xét theo quan điểm của nguồn lực tài chính sẵn có và mức độ am hiểu thị trường tài chính.
Sử dụng thông tin: sử dụng toàn bộ hay riêng biệt các dữ liệu trên trang web của công ty TeleTrade như một nguồn cung cấp thông tin nhất định. Việc sử dụng tư liệu từ trang web cần kèm theo liên kết đến trang teletrade.vn. Việc tự động thu thập số liệu cũng như thông tin từ trang web TeleTrade đều không được phép.
Xin vui lòng liên hệ với pr@teletrade.global nếu có câu hỏi.
ngân hàng