- Phân tích
- Tin tức và các công cụ
- Tin tức thị trường
- Gold Price Forecast: XAU/USD fits above $1960 as USD looks fragile, US CPI hogs limelight
Gold Price Forecast: XAU/USD fits above $1960 as USD looks fragile, US CPI hogs limelight
- Gold price has got acceptance above $1,960.00 ahead of the US inflation data.
- The energy component is expected to keep significant pressure on US inflation.
- A clash of US CPI data and a volatile contraction pattern by the Gold price is going to deliver an explosion.
Gold price (XAU/USD) has shifted its auction above the crucial resistance of $1,960.00 ahead of the release of the United States Consumer Price Index (CPI) data, which will release at 12:30 GMT. The precious metal is expected to show volatile moves as investors are keenly awaiting the US inflation numbers to deduce cues about Federal Reserve’s (Fed) interest rate policy.
S&P500 futures are holding gains added from the Asian session as the odds of a neutral interest rate decision by the Fed are extremely solid. Market sentiment is quite upbeat and the appeal of risk-sensitive assets is stronger.
The US Dollar Index (DXY) is looking vulnerable near its two-week low of around 103.20 as the market participants are anticipating that the energy component will keep significant pressure on the US inflation.
Analysts at NBF expect the energy component may have had a negative impact on the headline index as prices likely fell in both the gasoline and natural gas segments. Expected gains for shelter could still result in a 0.2% monthly increase in headline prices. If we’re right, the annual rate should come down from 4.9% to a two-year low of 4.1%. The core index, meanwhile, could have advanced 0.3% on a monthly basis, something which would translate into a 5.1% annual gain.
The pressure of higher chances for a neutral Fed policy is visible on US Treasury yields. The return delivered on 10-year US Treasury bonds has dropped to near 3.72%.
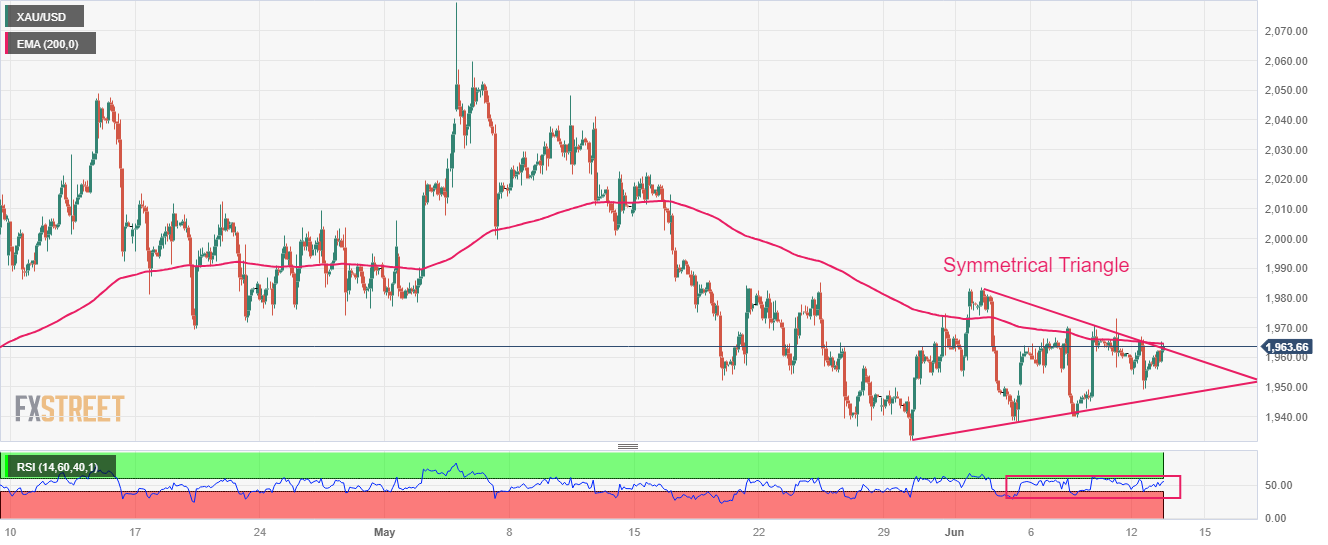
Gold technical analysis
Investors should be prepared for a sheer volatile action by the Gold price ahead of the US inflation data. Gold price has been forming a Symmetrical Triangle chart pattern on a two-hour scale and a clash of first-tier US economic data and a volatile contraction pattern is going to deliver an explosion, which will be followed by wider ticks and heavy volume.
The 50-period Exponential Moving Average (EMA) at $1,964.48 is sticky with the Gold price, portraying non-directional movements.
Adding to that, the Relative Strength Index (RSI) (14) is oscillating in the 40.00-60.00 range, which indicates that investors await crucial data.
Gold price two-hour chart


© 2000-2026. Bản quyền Teletrade.
Trang web này được quản lý bởi Teletrade D.J. LLC 2351 LLC 2022 (Euro House, Richmond Hill Road, Kingstown, VC0100, St. Vincent and the Grenadines).
Thông tin trên trang web không phải là cơ sở để đưa ra quyết định đầu tư và chỉ được cung cấp cho mục đích làm quen.
Giao dịch trên thị trường tài chính (đặc biệt là giao dịch sử dụng các công cụ biên) mở ra những cơ hội lớn và tạo điều kiện cho các nhà đầu tư sẵn sàng mạo hiểm để thu lợi nhuận, tuy nhiên nó mang trong mình nguy cơ rủi ro khá cao. Chính vì vậy trước khi tiến hành giao dịch cần phải xem xét mọi mặt vấn đề chấp nhận tiến hành giao dịch cụ thể xét theo quan điểm của nguồn lực tài chính sẵn có và mức độ am hiểu thị trường tài chính.
Sử dụng thông tin: sử dụng toàn bộ hay riêng biệt các dữ liệu trên trang web của công ty TeleTrade như một nguồn cung cấp thông tin nhất định. Việc sử dụng tư liệu từ trang web cần kèm theo liên kết đến trang teletrade.vn. Việc tự động thu thập số liệu cũng như thông tin từ trang web TeleTrade đều không được phép.
Xin vui lòng liên hệ với pr@teletrade.global nếu có câu hỏi.
ngân hàng