- Phân tích
- Tin tức và các công cụ
- Tin tức thị trường
- Gold Price Forecast: XAU/USD finds resistance above $1,950 amid a temporary pause in USD Index’s sell-off
Gold Price Forecast: XAU/USD finds resistance above $1,950 amid a temporary pause in USD Index’s sell-off
- Gold price has sensed resistance around $1,952.00 as the focus shifts to Fed policy.
- The downside bias for the USD index has not faded yet as a temporary pause in the policy-tightening spell by the Fed is likely.
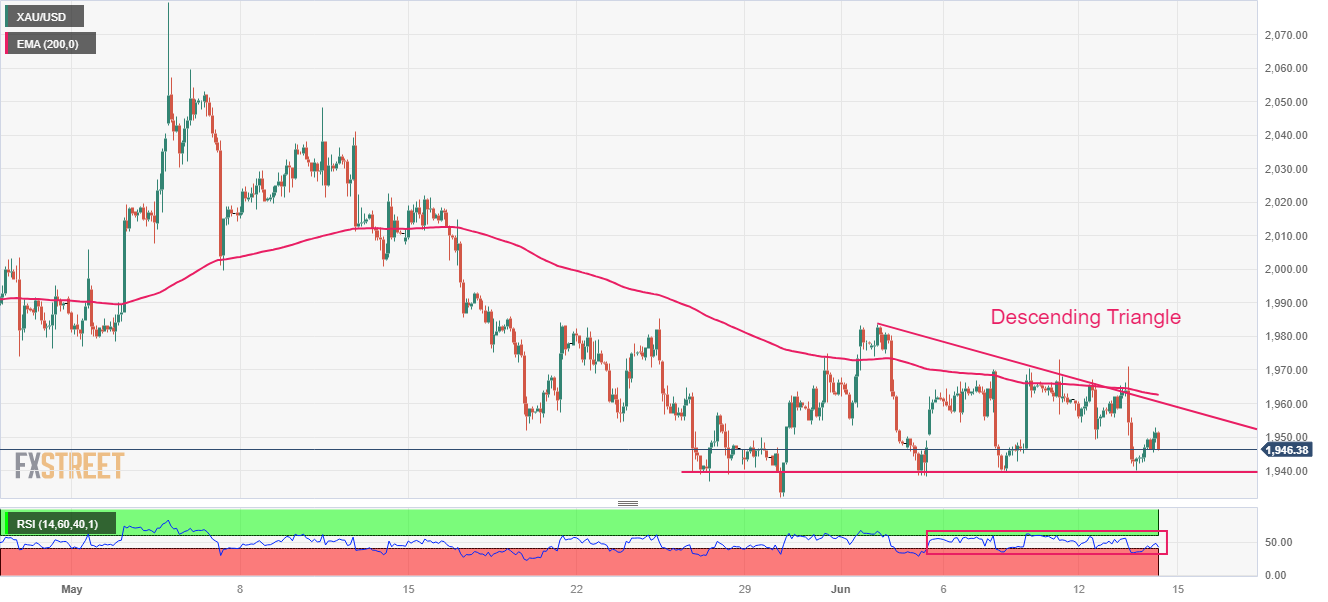
- Gold price is auctioning in a Descending Triangle chart pattern, which indicates a sheer contraction in volatility.
Gold price (XAU/USD) has sensed some selling pressure after advancing to near $1,952.00 in the European session. The precious metal has faced delicate resistance as the US Dollar Index (DXY) has displayed a short-term pause after a vertical sell-off. The downside bias for the USD index has not faded yet as a temporary pause in the policy-tightening spell by the Federal Reserve (Fed) is likely.
S&P500 futures are holding gains added in early Europe in hopes that a neutral interest rate policy announcement by Fed chair Jerome Powell would infuse optimism among the market participants. Investors should be prepared for any worse situation as an unexpected interest rate hike would dampen the market sentiment.
As per the CME Fedwatch tool, more than 95% chances are in favor of a steady interest rate policy. The risk profile could get dampened if the dot plot by the Fed turns out to be extremely hawkish. No doubt, United States inflation has softened and tight labor market conditions have released some heat. Headline inflation is still double the targeted rate of 2% and the US economy is still operating at full employment levels.
Apart from the Fed policy, investors will also focus on the US Producer Price Index (PPI) data. Monthly headline PPI is expected to show a deflation of 0.1% as gasoline prices have dropped significantly. While monthly core PPI that excludes oil and food prices is expected to maintain a 0.2% pace.
Gold technical analysis
Gold price is auctioning in a Descending Triangle chart pattern on a two-hour scale, which indicates a sheer contraction in volatility. The downward-sloping trendline of the aforementioned chart pattern is plotted from June 02 high at $1,983.50 while the horizontal support is placed from June 25 low at $1,939.32.
The 200-period Exponential Moving Average (EMA) at $1,962.34 is consistently barricading Gold bulls from any recovery.
An oscillation in the 40.00-60.00 range by the Relative Strength Index (RSI) (14) indicates that investors are awaiting the Fed policy for further action.
Gold two-hour chart


© 2000-2026. Bản quyền Teletrade.
Trang web này được quản lý bởi Teletrade D.J. LLC 2351 LLC 2022 (Euro House, Richmond Hill Road, Kingstown, VC0100, St. Vincent and the Grenadines).
Thông tin trên trang web không phải là cơ sở để đưa ra quyết định đầu tư và chỉ được cung cấp cho mục đích làm quen.
Giao dịch trên thị trường tài chính (đặc biệt là giao dịch sử dụng các công cụ biên) mở ra những cơ hội lớn và tạo điều kiện cho các nhà đầu tư sẵn sàng mạo hiểm để thu lợi nhuận, tuy nhiên nó mang trong mình nguy cơ rủi ro khá cao. Chính vì vậy trước khi tiến hành giao dịch cần phải xem xét mọi mặt vấn đề chấp nhận tiến hành giao dịch cụ thể xét theo quan điểm của nguồn lực tài chính sẵn có và mức độ am hiểu thị trường tài chính.
Sử dụng thông tin: sử dụng toàn bộ hay riêng biệt các dữ liệu trên trang web của công ty TeleTrade như một nguồn cung cấp thông tin nhất định. Việc sử dụng tư liệu từ trang web cần kèm theo liên kết đến trang teletrade.vn. Việc tự động thu thập số liệu cũng như thông tin từ trang web TeleTrade đều không được phép.
Xin vui lòng liên hệ với pr@teletrade.global nếu có câu hỏi.
ngân hàng